

Question: Please write a code that will work on Matlab The table below shows values of the outflow concentration of a chemical from a reactor (c)
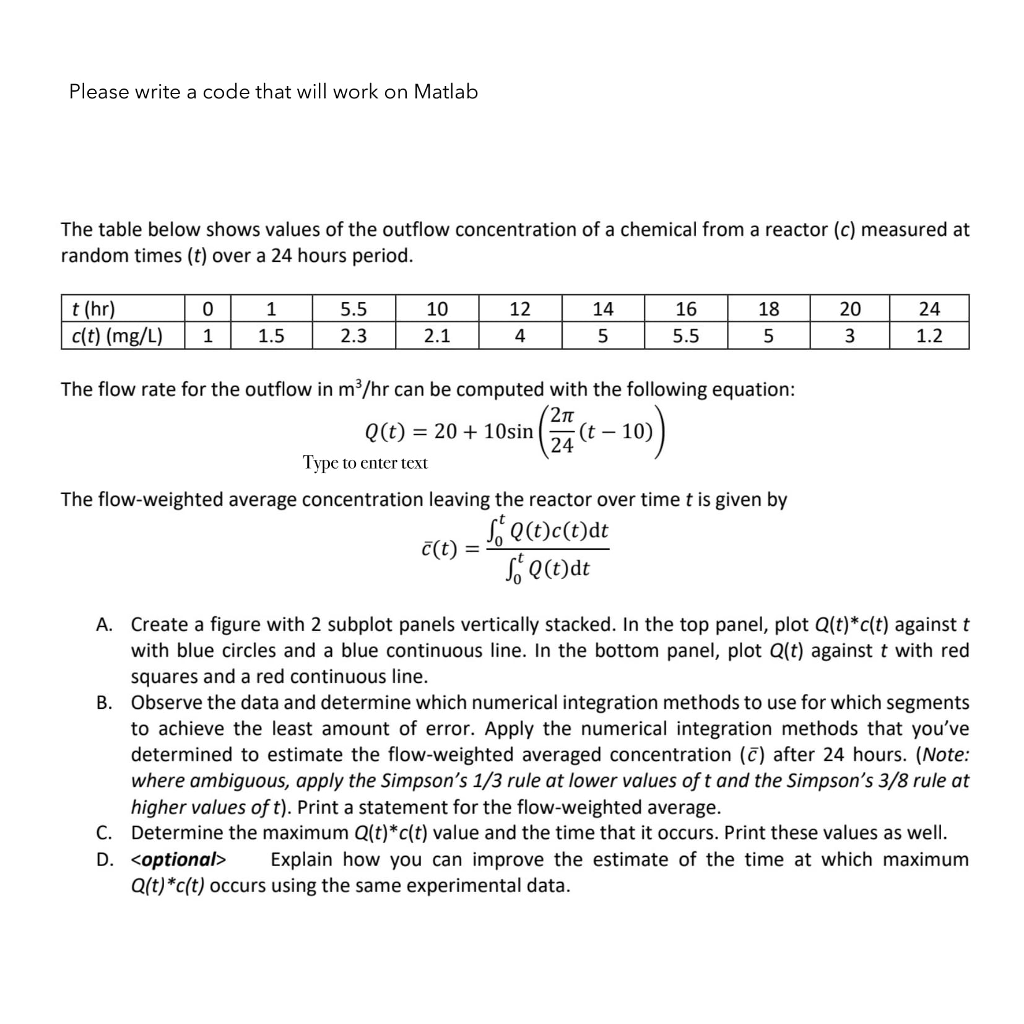
Please write a code that will work on Matlab The table below shows values of the outflow concentration of a chemical from a reactor (c) measured at random times (t) over a 24 hours period. t (hr c(t) (mg/L) 11.52.3 10 2.1 12 4 14 5 16 5.5 18 5 24 1.2 0 1 5.5 20 The flow rate for the outflow in m3/hr can be computed with the following equation: 2() - 20 + 10sin 24(t-10) Type to enter text The flow-weighted average concentration leaving the reactor over time t is given by 0 Create a figure with 2 subplot panels vertically stacked. In the top panel, plot Q(t)*c(t) against t with blue circles and a blue continuous line. In the bottom panel, plot Q(t) against t with red squares and a red continuous line. A. B. Observe the data and determine which numerical integration methods to use for which segments to achieve the least amount of error. Apply the numerical integration methods that you've determined to estimate the flow-weighted averaged concentration (C) after 24 hours. (Note: where ambiguous, apply the Simpson's 1/3 rule at lower values of t and the Simpson's 3/8 rule at higher values of t). Print a statement for the flow-weighted average. Determine the maximum Q(t)*c(t) value and the time that it occurs. Print these values as well. C. D.
Step by Step Solution
There are 3 Steps involved in it

Get step-by-step solutions from verified subject matter experts