

Question: Please write a Matlab code as the solution to the following task. In lectures we considered the problem of phosphorous exchange between the upper and
Please write a Matlab code as the solution to the following task.
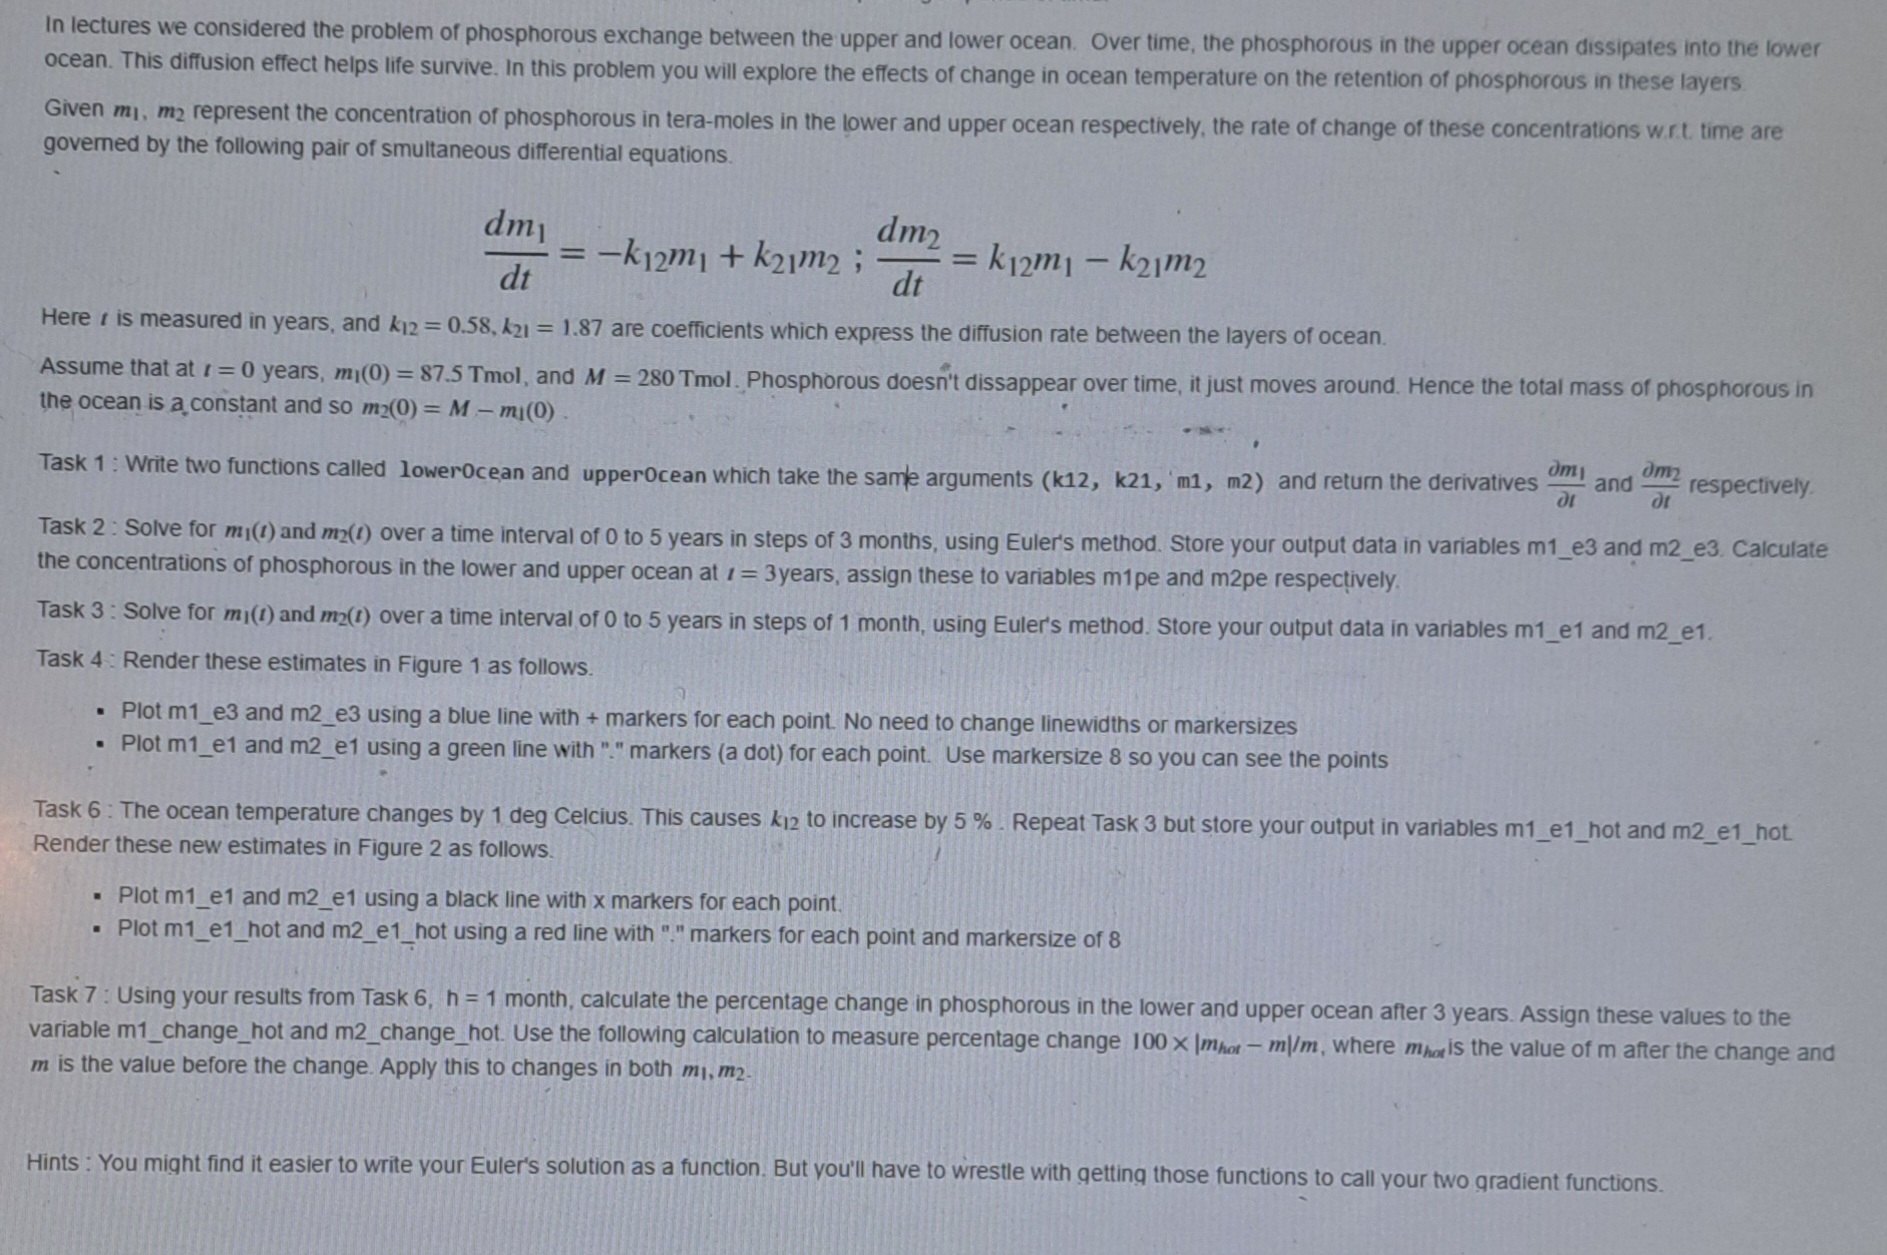
In lectures we considered the problem of phosphorous exchange between the upper and lower ocean. Over time, the phosphorous in the upper ocean dissipates into the lower
ocean. This diffusion effect helps life survive. In this problem you will explore the effects of change in ocean temperature on the retention of phosphorous in these layers
Given represent the concentration of phosphorous in teramoles in the lower and upper ocean respectively, the rate of change of these concentrations wrt time are
governed by the following pair of smultaneous differential equations.
;
Here is measured in years, and are coefficients which express the diffusion rate between the layers of ocean.
Assume that at years, Tmol, and Tmol. Phosphorous doesn't dissappear over time, it just moves around. Hence the total mass of phosphorous in
the ocean is a constant and so
Task : Write two functions called lowerocean and uppercean which take the samle arguments k and return the derivatives and respectively.
Task : Solve for and over a time interval of to years in steps of months, using Euler's method. Store your output data in variables and e Calculate
the concentrations of phosphorous in the lower and upper ocean at years, assign these to variables pe and pe respectively.
Task : Solve for and over a time interval of to years in steps of month, using Euler's method. Store your output data in variables e and e
Task : Render these estimates in Figure as follows.
Plot me and me using a blue line with markers for each point. No need to change linewidths or markersizes
Plot me and me using a green line with markers a dot for each point. Use markersize so you can see the points
Task : The ocean temperature changes by deg Celcius. This causes to increase by Repeat Task but store your output in variables ehot and ehot.
Render these new estimates in Figure as follows.
Plot me and me using a black line with x markers for each point.
Plot ehot and dots hot using a red line with markers for each point and markersize of
Task : Using your results from Task month, calculate the percentage change in phosphorous in the lower and upper ocean after years. Assign these values to the
variable changehot and changehot. Use the following calculation to measure percentage change where is the value of after the change and
is the value before the change. Apply this to changes in both
Hints: You might find it easier to write your Euler's solution as a function. But you'll have to wrestle with qetting those functions to call your two qradient functions.
Step by Step Solution
There are 3 Steps involved in it
1 Expert Approved Answer
Step: 1 Unlock

Question Has Been Solved by an Expert!
Get step-by-step solutions from verified subject matter experts
Step: 2 Unlock
Step: 3 Unlock