

Question: Please write a MATLAB code to implement Lagrange interpolation based on below 5 data points After interpolation, please plot data points and interpolation curve in
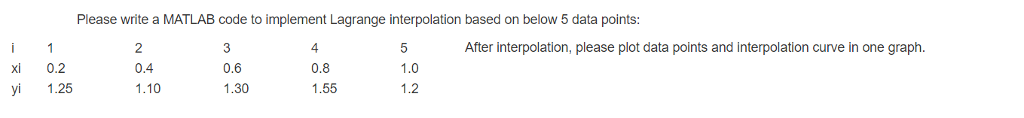
Please write a MATLAB code to implement Lagrange interpolation based on below 5 data points After interpolation, please plot data points and interpolation curve in one graph. 2 0.4 1.10 3 0.6 1.30 4 0.8 1.55 1.0 1.2 xi 0.2 yi 1.25
Step by Step Solution
There are 3 Steps involved in it
1 Expert Approved Answer
Step: 1 Unlock

Question Has Been Solved by an Expert!
Get step-by-step solutions from verified subject matter experts
Step: 2 Unlock
Step: 3 Unlock