

Question: Please write in a few sentences analyzing this DCF sensitivity analysis. included the DCF analysis for a reference SENSITIVITY ANALYSIS (USD in millions, except per
Please write in a few sentences analyzing this DCF sensitivity analysis. included the DCF analysis for 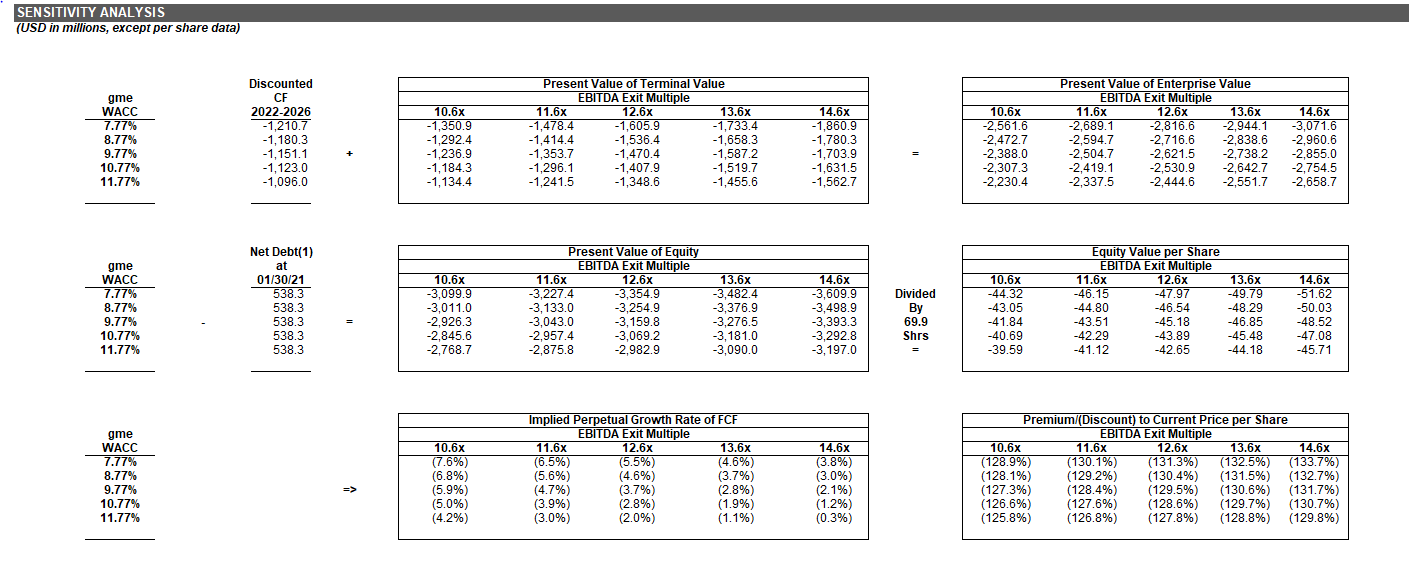
 a reference
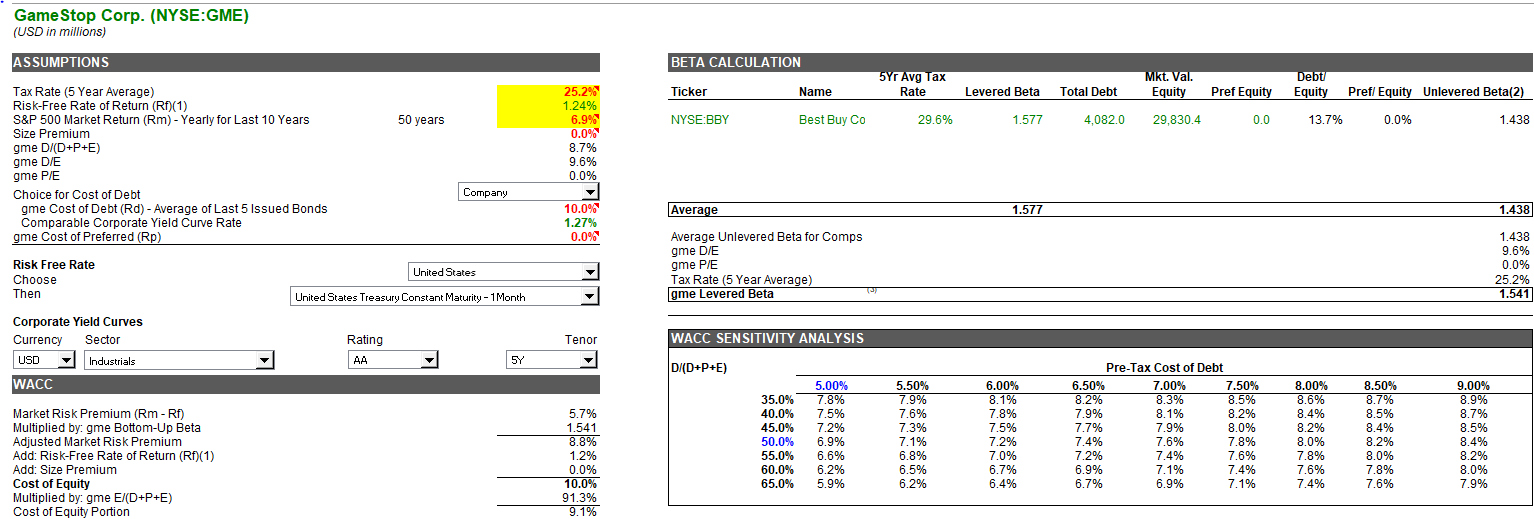
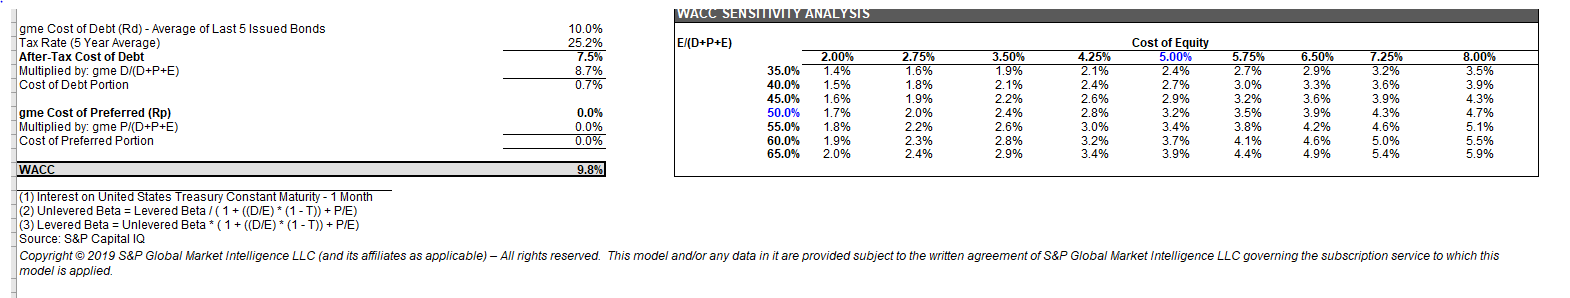
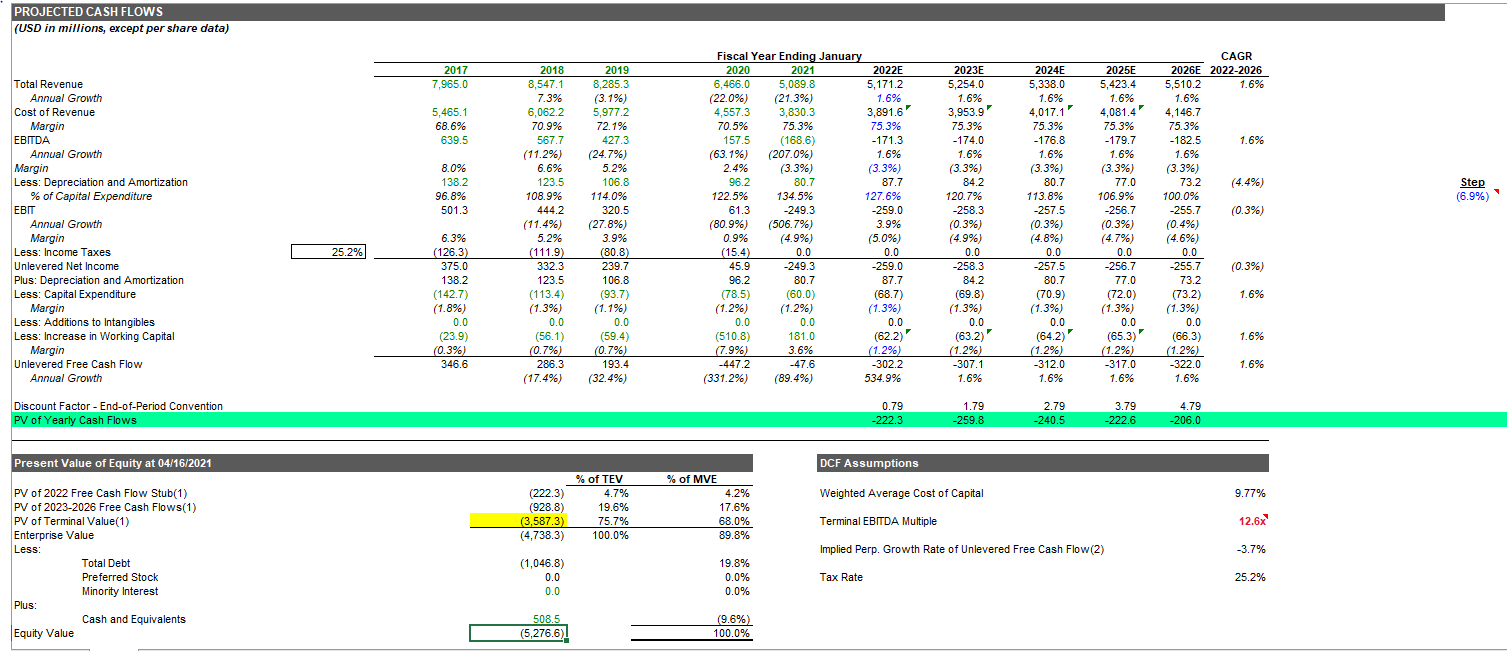
SENSITIVITY ANALYSIS (USD in millions, except per share data) gme WACC 7.77% 8.77% 9.77% 10.77% 11.77% Discounted CF 2022-2026 -1,210.7 -1,180.3 -1,151.1 - 1,123.0 -1,096.0 10.6x -1,350.9 -1,292.4 -1,236.9 -1,184.3 -1,134.4 Present Value of Terminal Value EBITDA Exit Multiple 11.6x 12.6x 13.6x -1,478.4 -1.605.9 -1,733.4 -1,414.4 -1,536.4 -1,658.3 -1,353.7 -1,470.4 -1,587.2 -1,296.1 -1,407.9 -1,519.7 -1,241.5 -1,348.6 - 1,455.6 14.6x -1,860.9 -1,780.3 -1,703.9 -1,631.5 -1.562.7 10.6x -2,561.6 -2.472.7 -2,388.0 -2,307.3 -2,230.4 Present Value of Enterprise Value EBITDA Exit Multiple 11.6x 12.6x 13.6x -2,689.1 -2,816.6 -2.944.1 -2,594.7 -2,716.6 -2,838.6 -2,504.7 -2,621.5 -2,738.2 -2,419.1 -2,530.9 -2,642.7 -2,337.5 -2,444.6 -2.551.7 14.6x -3,071.6 -2,960.6 -2,855.0 -2,754.5 -2,658.7 53588055555555380 gme WACC 7.77% 8.77% 9.77% 10.77% 11.77% Net Debt(1) at 01/30/21 538.3 538.3 538.3 538.3 538.3 10.6x -3,099.9 -3,011.0 -2,926.3 -2,845.6 -2,768.7 Present Value of Equity EBITDA Exit Multiple 11.6x 12.6x -3,227.4 -3,354.9 -3.133.0 -3,254.9 -3,043.0 -3,159.8 -2,957.4 -3,069.2 -2,875.8 -2,982.9 13.6x -3,4824 -3,376.9 -3.276.5 -3,181.0 -3,090.0 14.6x -3,609.9 -3,498.9 -3,393.3 -3,292.8 -3,197.0 Divided 69.9 Shrs 10.6x -44.32 -43.05 -41.84 -40.69 -39.59 Equity Value per Share EBITDA Exit Multiple 11.6x 12.6x 13.6x -46.15 -47.97 -49.79 -44.80 -46.54 -48.29 -43.51 -45.18 -46.85 -42.29 -43.89 -45.48 -41.12 -42.65 -44.18 14.6x -51.62 -50.03 -48.52 -47.08 -45.71 = gme WACC 7.77% 8.77% 9.77% 10.77% 11.77% 10.6x (7.6%) (6.8%) (5.9%) (5.0%) (4.2%) Implied Perpetual Growth Rate of FCF EBITDA Exit Multiple 11.6x 12.6x 13.6x (6.5%) (5.5%) (4.6%) (5.6%) (4.6%) (3.7%) (4.7%) (3.7%) (2.8%) (3.9%) (2.8%) (1.9%) (3.0%) (2.0%) (1.1%) 14.6x (3.8%) (3.0%) (2.1%) (1.2%) (0.3%) Premium/(Discount) to Current Price per Share EBITDA Exit Multiple 10.6x 11.6x 12.6x 13.6x 14.6x (128.9%) (130.1%) (131.3%) (132.5%) (133.7%) (128.1%) (129.2%) (130.4%) (131.5%) (132.7%) (127.3%) (128.4%) (129.5%) (130.6%) (131.7%) (126.6%) (127.6%) (128.6%) (129.7%) (130.7%) (125.8%) (126.8%) (127.8%) (128.8%) (129.8%) Game Stop Corp. (NYSE:GME) (USD in millions) ASSUMPTIONS BETA CALCULATION 5Yr Avg Tax Rate Debt Equity Name Levered Beta Mkt. Val. Equity Total Debt Pref Equity Prefi Equity Unlevered Beta(2) Ticker NYSE:BBY : 50 years Best Buy Co 29.6% 1.577 Tax Rate (5 Year Average) Risk-Free Rate of Return (Rp) (1) S&P 500 Market Return (Rm) - Yearly for Last 10 Years Size Premium gme D/CD+P+E) gme D/E 4,082.0 29,830.4 0.0 13.7% 0.0% 1.438 25.2% 1.24% 6.9% 0.0% 8.7% 9.6% 0.0% gme P/E Company Average 1.577 Choice for Cost of Debt gme Cost of Debt (Rd) - Average of Last 5 Issued Bonds Comparable Corporate Yield Curve Rate gme Cost of Preferred (Rp) 1.438 10.0% 1.27% 0.0% Risk Free Rate Choose Then Average Unlevered Beta for Comps gme D/E gme P/E Tax Rate (5 Year Average) gme Levered Beta 1.438 9.6% 0.0% 25.2% 1.541 United States United States Treasury Constant Maturity - 1 Month Corporate Yield Curves Currency Sector USD Industrials Rating Tenor WACC SENSITIVITY ANALYSIS AA 5Y D/CD+P+E) WACC Market Risk Premium (Rm - Rf) Multiplied by: gme Bottom-Up Beta Adjusted Market Risk Premium Add: Risk-Free Rate of Return (Rf)(1) Add: Size Premium Cost of Equity Multiplied by: gme E/(D+P+E) Cost of Equity Portion TII 5.7% 1.541 8.8% 1.2% 0.0% 10.0% 91.3% 9.1% 35.0% 40.0% 45.0% 50.0% 55.0% 60.0% 65.0% 5.00% % 7.8% 7.5% 7.2% 6.9% 6.6% 6.2% 5.9% 5.50% 7.9% 7.6% 7.3% 7.1% 6.8% 6.5% 6.2% 6.00% 8.1% 7.8% 7.5% 7.2% % 7.0% 6.7% 6.4% Pre-Tax Cost of Debt 6.50% 7.00% 7.50% 8.2% 8.3% 8.5% 7.9% 8.1% 8.2% 7.7% 7.9% 8.0% 7.4% 7.6% 7.8% % 7.2% 7.4% 7.6% 6.9% 7.1% 7.4% 6.7% 6.9% 7.1% 8.00% 8.6% 8.4% 8.2% 8.0% 7.8% 7.6% 7.4% 8.50% 8.7% 8.5% 8.4% 8.2% 8.0% 7.8% 7.6% % 9.00% 8.9% 8.7% 8.5% 8.4% 8.2% 8.0% 7.9% WACC SENSITIVITY ANALYSIS E/(D+P+E) gme Cost of Debt (Rd) - Average of Last 5 Issued Bonds Tax Rate (5 Year Average) After-Tax Cost of Debt Multiplied by: gme D/(D+P+E) Cost of Debt Portion 10.0% 25.2% 7.5% 8.7% 0.7% 2.00% 1.4% 1.5% 1.6% 1.7% 1.8% 1.9% 2.0% 35.0% 40.0% 45.0% 50.0% 55.0% 60.0% 65.0% 2.75% 1.6% 1.8% 1.9% 2.0% 2.2% 2.3% 2.4% gme Cost of Preferred (Rp) Multiplied by: gme P/(D+P+E) Cost of Preferred Portion 3.50% 1.9% 2.1% 2.2% 2.4% 2.6% 2.8% 2.9% 4.25% 2.1% 2.4% 2.6% 2.8% 3.0% 3.2% 3.4% Cost of Equity 5.00% 2.4% 2.7% 2.9% 3.2% 3.4% 3.7% 3.9% 5.75% 2.7% 3.0% 3.2% 3.5% 3.8% 4.1% 4.4% 6.50% 2.9% 3.3% 3.6% 3.9% 4.2% 4.6% 4.9% 7.25% 3.2% 3.6% 3.9% 4.3% 4.6% 5.0% 5.4% 8.00% 3.5% 3.9% 4.3% 4.7% 5.1% 5.5% 5.9% 0.0% 0.0% 0.0% WACC 9.8% (1) Interest on United States Treasury Constant Maturity - 1 Month (2) Unlevered Beta = Levered Beta /(1 + ((D/E)*(1-1)) + P/E) (3) Levered Beta = Unlevered Beta *(1 + ((D/E) * (1 - T)) + P/E) Source: S&P Capital IQ Copyright 2019 S&P Global Market Intelligence LLC (and its affiliates as applicable) All rights reserved. This model and/or any data in it are provided subject to the written agreement of S&P Global Market Intelligence LLC governing the subscription service to which this model is applied. PROJECTED CASH FLOWS (USD in millions, except per share data) 2017 7,965.0 2019 8,285.3 (3.1%) 2024E 5,338,0 1.6% 2025E 5,423.4 1.6% CAGR 2026E 2022-2026 5,510.2 1.6% 1.6% 5,977.2 3,830.3 2023E 5,254.0 1.6% 3,953.97 75.3% -174.0 1.6% 4,017.1" 4,081.4) 5,465.1 68.6% 639.5 4,146.7 75.3% -176.8 1.6% 75.3% -179.7 1.6% 1.6% (3.3%) (3.3%) (3.3%) 8.0% 138.2 96.8% 501.3 Step (6.9%) (0.3%) Total Revenue Annual Growth Cost of Revenue Margin EBITDA Annual Growth Margin Less: Depreciation and Amortization % of Capital Expenditure EBIT Annual Growth Margin Less: Income Taxes Unlevered Net Income Plus: Depreciation and Amortization Less: Capital Expenditure Margin Less: Additions to Intangibles Less: Increase in Working Capital Margin Unlevered Free Cash Flow Annual Growth 2018 8,547.1 7.3% 6,062.2 70.9% 567.7 (11.2%) 6.6% 123.5 108.9% 444.2 (11.4%) 5.2% (111.9) 332.3 123.5 (113.4) (1.3%) 0.0 (56.1) (0.7%) 286.3 (17.4%) 72.1% 427.3 (24.7%) 5.2% 106.8 114.0% 320.5 (27.8%) 3.9% (80.8) 239.7 106.8 (93.7) (1.1%) 0.0 Fiscal Year Ending January 2020 2021 2022E 6,466.0 5,089.8 5,171.2 (22.0%) (21.3%) 1.6% % 4,5573 3,891.6' 70.5% 75.3% 75.3% 157.5 (168.6) -171.3 (63.1%) (207.0%) 1.6% % 2.4% (3.3%) (3.3%) 96.2 80.7 87.7 122.5% 134.5% 127.6% 61.3 -249.3 -259.0 (80.9%) (506.7%) 3.9% 0.9% (4.9%) (5.0%) (15.4) 0.0 0.0 45.9 -249.3 -259.0 96.2 80.7 87.7 (78.5) (60.0) (68.7) (1.2%) (1.2%) (1.3%) 0.0 0.0 0.0 (510.8) 181.0 (62.2) (7.9%) 3.6% (1.2%) -447.2 -47.6 302.2 (331.2%) (89.4%) 534.9% - 25.2% 25.2% (0.3%) 84.2 120.7% -258.3 (0.3%) (4.9%) 0.0 -258.3 84.2 (69.8) (1.3%) 0.0 (63.2) (1.2%) -307.1 1.6% 6.3% (126.3) 375.0 138.2 (142.7) (1.8%) 0.0 (23.9) (0.3%) 346.6 80.7 113.8% -257.5 (0.3%) (4.8%) 0.0 -257.5 80.7 (70.9) (1.3%) 0.0 (64.2) (1.2%) -312.0 1.6% 75.3% -182.5 1.6% (3.3%) 73.2 100.0% -255.7 (0.4%) (4.6%) 0.0 -255.7 73.2 (73.2) (1.3%) 0.0 (66.3) (1.2%) -322.0 1.6% 77.0 106.9% -256.7 (0.3%) (4.7%) 0.0 -256.7 77.0 (72.0) (1.3%) 0.0 (65.3) (1.2%) 317.0 1.6% 1.6% (59.4) 1.6% (0.7%) 193.4 (32.4% 1.6% Discount Factor-End-of-Period Convention PV of Yearly Cash Flows 0.79 -222.3 1.79 -259,8 2.79 -240.5 3.79 -222.6 4.79 -206.0 Present Value of Equity at 04/16/20 DCF Assumptions Weighted Average Cost of Capital 9.77% PV of 2022 Free Cash Flow Stub(1) PV of 2023-2026 Free Cash Flows(1) PV of Terminal Value(1) Enterprise Value (222.3) (928.8) (3.587.3) (4,738.3) % of TEV 4.7% 19.6% 75.7% 100.0% % of MVE 4.2% 17.6% 68.0% 89.8% Terminal EBITDA Multiple 12.6x Less Implied Perp. Growth Rate of Unlevered Free Cash Flow (2) -3.7% Total Debt Preferred Stock Minority Interest (1,046.8) 0.0 0.0 19.8% 0.0% 0.0% Tax Rate 25.2% Plus: Cash and Equivalents 508.5 (5,276.6) (9.6%) 100.0% Equity Value SENSITIVITY ANALYSIS (USD in millions, except per share data) gme WACC 7.77% 8.77% 9.77% 10.77% 11.77% Discounted CF 2022-2026 -1,210.7 -1,180.3 -1,151.1 - 1,123.0 -1,096.0 10.6x -1,350.9 -1,292.4 -1,236.9 -1,184.3 -1,134.4 Present Value of Terminal Value EBITDA Exit Multiple 11.6x 12.6x 13.6x -1,478.4 -1.605.9 -1,733.4 -1,414.4 -1,536.4 -1,658.3 -1,353.7 -1,470.4 -1,587.2 -1,296.1 -1,407.9 -1,519.7 -1,241.5 -1,348.6 - 1,455.6 14.6x -1,860.9 -1,780.3 -1,703.9 -1,631.5 -1.562.7 10.6x -2,561.6 -2.472.7 -2,388.0 -2,307.3 -2,230.4 Present Value of Enterprise Value EBITDA Exit Multiple 11.6x 12.6x 13.6x -2,689.1 -2,816.6 -2.944.1 -2,594.7 -2,716.6 -2,838.6 -2,504.7 -2,621.5 -2,738.2 -2,419.1 -2,530.9 -2,642.7 -2,337.5 -2,444.6 -2.551.7 14.6x -3,071.6 -2,960.6 -2,855.0 -2,754.5 -2,658.7 53588055555555380 gme WACC 7.77% 8.77% 9.77% 10.77% 11.77% Net Debt(1) at 01/30/21 538.3 538.3 538.3 538.3 538.3 10.6x -3,099.9 -3,011.0 -2,926.3 -2,845.6 -2,768.7 Present Value of Equity EBITDA Exit Multiple 11.6x 12.6x -3,227.4 -3,354.9 -3.133.0 -3,254.9 -3,043.0 -3,159.8 -2,957.4 -3,069.2 -2,875.8 -2,982.9 13.6x -3,4824 -3,376.9 -3.276.5 -3,181.0 -3,090.0 14.6x -3,609.9 -3,498.9 -3,393.3 -3,292.8 -3,197.0 Divided 69.9 Shrs 10.6x -44.32 -43.05 -41.84 -40.69 -39.59 Equity Value per Share EBITDA Exit Multiple 11.6x 12.6x 13.6x -46.15 -47.97 -49.79 -44.80 -46.54 -48.29 -43.51 -45.18 -46.85 -42.29 -43.89 -45.48 -41.12 -42.65 -44.18 14.6x -51.62 -50.03 -48.52 -47.08 -45.71 = gme WACC 7.77% 8.77% 9.77% 10.77% 11.77% 10.6x (7.6%) (6.8%) (5.9%) (5.0%) (4.2%) Implied Perpetual Growth Rate of FCF EBITDA Exit Multiple 11.6x 12.6x 13.6x (6.5%) (5.5%) (4.6%) (5.6%) (4.6%) (3.7%) (4.7%) (3.7%) (2.8%) (3.9%) (2.8%) (1.9%) (3.0%) (2.0%) (1.1%) 14.6x (3.8%) (3.0%) (2.1%) (1.2%) (0.3%) Premium/(Discount) to Current Price per Share EBITDA Exit Multiple 10.6x 11.6x 12.6x 13.6x 14.6x (128.9%) (130.1%) (131.3%) (132.5%) (133.7%) (128.1%) (129.2%) (130.4%) (131.5%) (132.7%) (127.3%) (128.4%) (129.5%) (130.6%) (131.7%) (126.6%) (127.6%) (128.6%) (129.7%) (130.7%) (125.8%) (126.8%) (127.8%) (128.8%) (129.8%) Game Stop Corp. (NYSE:GME) (USD in millions) ASSUMPTIONS BETA CALCULATION 5Yr Avg Tax Rate Debt Equity Name Levered Beta Mkt. Val. Equity Total Debt Pref Equity Prefi Equity Unlevered Beta(2) Ticker NYSE:BBY : 50 years Best Buy Co 29.6% 1.577 Tax Rate (5 Year Average) Risk-Free Rate of Return (Rp) (1) S&P 500 Market Return (Rm) - Yearly for Last 10 Years Size Premium gme D/CD+P+E) gme D/E 4,082.0 29,830.4 0.0 13.7% 0.0% 1.438 25.2% 1.24% 6.9% 0.0% 8.7% 9.6% 0.0% gme P/E Company Average 1.577 Choice for Cost of Debt gme Cost of Debt (Rd) - Average of Last 5 Issued Bonds Comparable Corporate Yield Curve Rate gme Cost of Preferred (Rp) 1.438 10.0% 1.27% 0.0% Risk Free Rate Choose Then Average Unlevered Beta for Comps gme D/E gme P/E Tax Rate (5 Year Average) gme Levered Beta 1.438 9.6% 0.0% 25.2% 1.541 United States United States Treasury Constant Maturity - 1 Month Corporate Yield Curves Currency Sector USD Industrials Rating Tenor WACC SENSITIVITY ANALYSIS AA 5Y D/CD+P+E) WACC Market Risk Premium (Rm - Rf) Multiplied by: gme Bottom-Up Beta Adjusted Market Risk Premium Add: Risk-Free Rate of Return (Rf)(1) Add: Size Premium Cost of Equity Multiplied by: gme E/(D+P+E) Cost of Equity Portion TII 5.7% 1.541 8.8% 1.2% 0.0% 10.0% 91.3% 9.1% 35.0% 40.0% 45.0% 50.0% 55.0% 60.0% 65.0% 5.00% % 7.8% 7.5% 7.2% 6.9% 6.6% 6.2% 5.9% 5.50% 7.9% 7.6% 7.3% 7.1% 6.8% 6.5% 6.2% 6.00% 8.1% 7.8% 7.5% 7.2% % 7.0% 6.7% 6.4% Pre-Tax Cost of Debt 6.50% 7.00% 7.50% 8.2% 8.3% 8.5% 7.9% 8.1% 8.2% 7.7% 7.9% 8.0% 7.4% 7.6% 7.8% % 7.2% 7.4% 7.6% 6.9% 7.1% 7.4% 6.7% 6.9% 7.1% 8.00% 8.6% 8.4% 8.2% 8.0% 7.8% 7.6% 7.4% 8.50% 8.7% 8.5% 8.4% 8.2% 8.0% 7.8% 7.6% % 9.00% 8.9% 8.7% 8.5% 8.4% 8.2% 8.0% 7.9% WACC SENSITIVITY ANALYSIS E/(D+P+E) gme Cost of Debt (Rd) - Average of Last 5 Issued Bonds Tax Rate (5 Year Average) After-Tax Cost of Debt Multiplied by: gme D/(D+P+E) Cost of Debt Portion 10.0% 25.2% 7.5% 8.7% 0.7% 2.00% 1.4% 1.5% 1.6% 1.7% 1.8% 1.9% 2.0% 35.0% 40.0% 45.0% 50.0% 55.0% 60.0% 65.0% 2.75% 1.6% 1.8% 1.9% 2.0% 2.2% 2.3% 2.4% gme Cost of Preferred (Rp) Multiplied by: gme P/(D+P+E) Cost of Preferred Portion 3.50% 1.9% 2.1% 2.2% 2.4% 2.6% 2.8% 2.9% 4.25% 2.1% 2.4% 2.6% 2.8% 3.0% 3.2% 3.4% Cost of Equity 5.00% 2.4% 2.7% 2.9% 3.2% 3.4% 3.7% 3.9% 5.75% 2.7% 3.0% 3.2% 3.5% 3.8% 4.1% 4.4% 6.50% 2.9% 3.3% 3.6% 3.9% 4.2% 4.6% 4.9% 7.25% 3.2% 3.6% 3.9% 4.3% 4.6% 5.0% 5.4% 8.00% 3.5% 3.9% 4.3% 4.7% 5.1% 5.5% 5.9% 0.0% 0.0% 0.0% WACC 9.8% (1) Interest on United States Treasury Constant Maturity - 1 Month (2) Unlevered Beta = Levered Beta /(1 + ((D/E)*(1-1)) + P/E) (3) Levered Beta = Unlevered Beta *(1 + ((D/E) * (1 - T)) + P/E) Source: S&P Capital IQ Copyright 2019 S&P Global Market Intelligence LLC (and its affiliates as applicable) All rights reserved. This model and/or any data in it are provided subject to the written agreement of S&P Global Market Intelligence LLC governing the subscription service to which this model is applied. PROJECTED CASH FLOWS (USD in millions, except per share data) 2017 7,965.0 2019 8,285.3 (3.1%) 2024E 5,338,0 1.6% 2025E 5,423.4 1.6% CAGR 2026E 2022-2026 5,510.2 1.6% 1.6% 5,977.2 3,830.3 2023E 5,254.0 1.6% 3,953.97 75.3% -174.0 1.6% 4,017.1" 4,081.4) 5,465.1 68.6% 639.5 4,146.7 75.3% -176.8 1.6% 75.3% -179.7 1.6% 1.6% (3.3%) (3.3%) (3.3%) 8.0% 138.2 96.8% 501.3 Step (6.9%) (0.3%) Total Revenue Annual Growth Cost of Revenue Margin EBITDA Annual Growth Margin Less: Depreciation and Amortization % of Capital Expenditure EBIT Annual Growth Margin Less: Income Taxes Unlevered Net Income Plus: Depreciation and Amortization Less: Capital Expenditure Margin Less: Additions to Intangibles Less: Increase in Working Capital Margin Unlevered Free Cash Flow Annual Growth 2018 8,547.1 7.3% 6,062.2 70.9% 567.7 (11.2%) 6.6% 123.5 108.9% 444.2 (11.4%) 5.2% (111.9) 332.3 123.5 (113.4) (1.3%) 0.0 (56.1) (0.7%) 286.3 (17.4%) 72.1% 427.3 (24.7%) 5.2% 106.8 114.0% 320.5 (27.8%) 3.9% (80.8) 239.7 106.8 (93.7) (1.1%) 0.0 Fiscal Year Ending January 2020 2021 2022E 6,466.0 5,089.8 5,171.2 (22.0%) (21.3%) 1.6% % 4,5573 3,891.6' 70.5% 75.3% 75.3% 157.5 (168.6) -171.3 (63.1%) (207.0%) 1.6% % 2.4% (3.3%) (3.3%) 96.2 80.7 87.7 122.5% 134.5% 127.6% 61.3 -249.3 -259.0 (80.9%) (506.7%) 3.9% 0.9% (4.9%) (5.0%) (15.4) 0.0 0.0 45.9 -249.3 -259.0 96.2 80.7 87.7 (78.5) (60.0) (68.7) (1.2%) (1.2%) (1.3%) 0.0 0.0 0.0 (510.8) 181.0 (62.2) (7.9%) 3.6% (1.2%) -447.2 -47.6 302.2 (331.2%) (89.4%) 534.9% - 25.2% 25.2% (0.3%) 84.2 120.7% -258.3 (0.3%) (4.9%) 0.0 -258.3 84.2 (69.8) (1.3%) 0.0 (63.2) (1.2%) -307.1 1.6% 6.3% (126.3) 375.0 138.2 (142.7) (1.8%) 0.0 (23.9) (0.3%) 346.6 80.7 113.8% -257.5 (0.3%) (4.8%) 0.0 -257.5 80.7 (70.9) (1.3%) 0.0 (64.2) (1.2%) -312.0 1.6% 75.3% -182.5 1.6% (3.3%) 73.2 100.0% -255.7 (0.4%) (4.6%) 0.0 -255.7 73.2 (73.2) (1.3%) 0.0 (66.3) (1.2%) -322.0 1.6% 77.0 106.9% -256.7 (0.3%) (4.7%) 0.0 -256.7 77.0 (72.0) (1.3%) 0.0 (65.3) (1.2%) 317.0 1.6% 1.6% (59.4) 1.6% (0.7%) 193.4 (32.4% 1.6% Discount Factor-End-of-Period Convention PV of Yearly Cash Flows 0.79 -222.3 1.79 -259,8 2.79 -240.5 3.79 -222.6 4.79 -206.0 Present Value of Equity at 04/16/20 DCF Assumptions Weighted Average Cost of Capital 9.77% PV of 2022 Free Cash Flow Stub(1) PV of 2023-2026 Free Cash Flows(1) PV of Terminal Value(1) Enterprise Value (222.3) (928.8) (3.587.3) (4,738.3) % of TEV 4.7% 19.6% 75.7% 100.0% % of MVE 4.2% 17.6% 68.0% 89.8% Terminal EBITDA Multiple 12.6x Less Implied Perp. Growth Rate of Unlevered Free Cash Flow (2) -3.7% Total Debt Preferred Stock Minority Interest (1,046.8) 0.0 0.0 19.8% 0.0% 0.0% Tax Rate 25.2% Plus: Cash and Equivalents 508.5 (5,276.6) (9.6%) 100.0% Equity Value
Step by Step Solution
There are 3 Steps involved in it

Get step-by-step solutions from verified subject matter experts