

Question: PLEASE WRITE MATLAB PROGRAM Create a function called histogram that returns an array containing the histogram of a data set that is passed to the
PLEASE WRITE MATLAB PROGRAM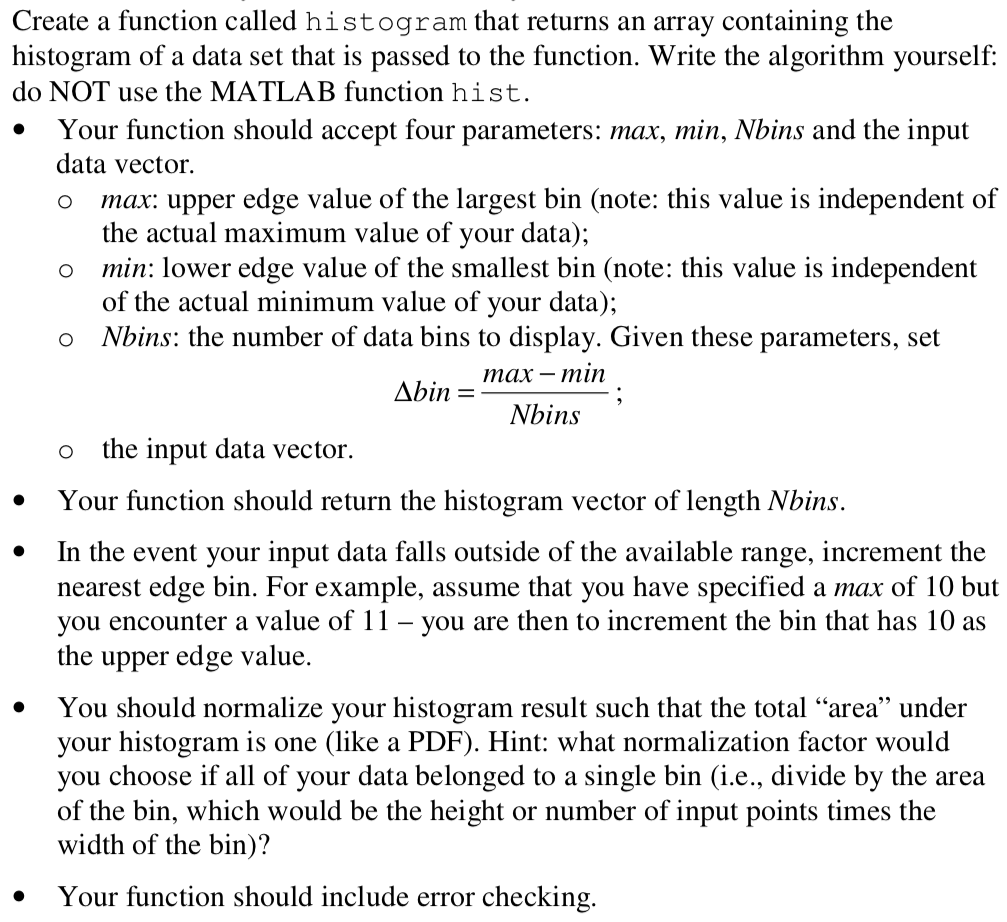
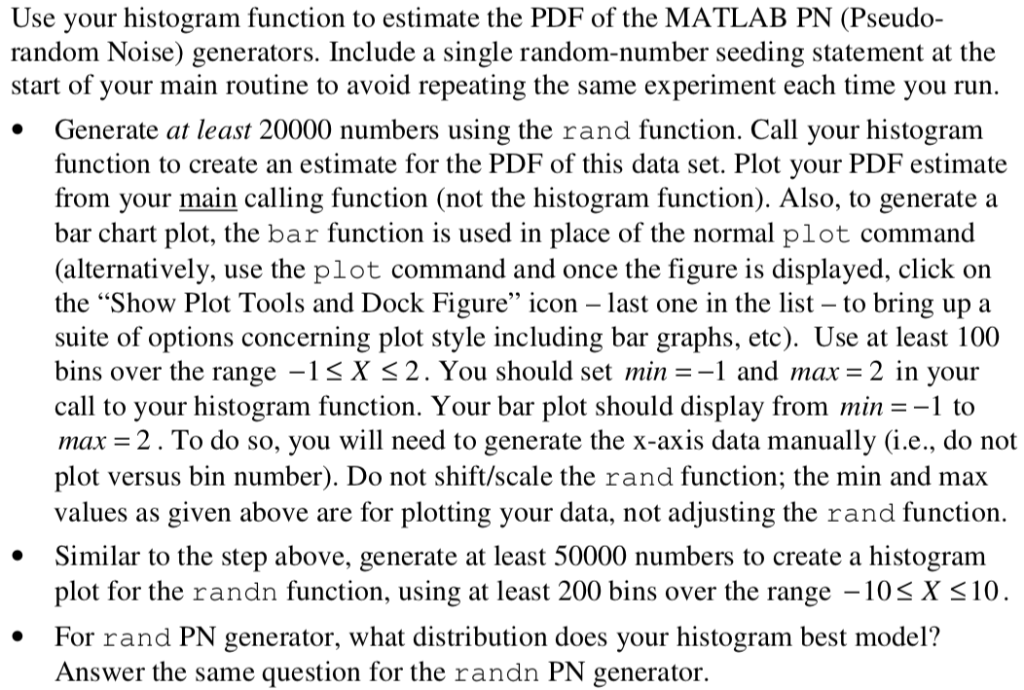
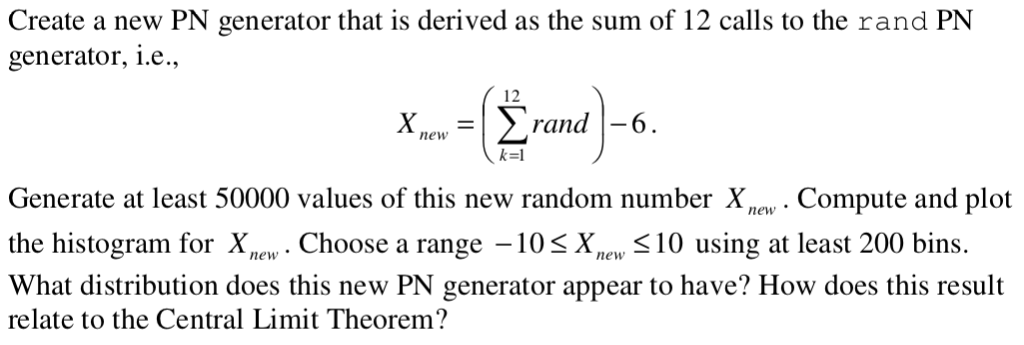
Create a function called histogram that returns an array containing the histogram of a data set that is passed to the function. Write the algorithm yourself: do NOT use the MATLAB function hist * Your function should accept four parameters: max, min, Nbins and the input data vector. o max: upper edge value of the largest bin (note: this value is independent of the actual maximum value of your data); min: lower edge value of the smallest bin (note: this value is independent of the actual minimum value of your data); Nbins: the number of data bins to display. Given these parameters, set o o max- min AbinNbins o the input data vector. Your function should return the histogram vector of length Nbins In the event your input data falls outside of the available range, increment the nearest edge bin. For example, assume that you have specified a max of 10 but vou encounter a value of 11-vou are then to increment the bin that has 10 as the upper edge value, * You should normalize your histogram result such that the total "area" under your histogram is one (like a PDF). Hint: what normalization factor would you choose if all of your data belonged to a single bin (i.e., divide by the area of the bin, which would be the height or number of input points times the width of the bin)? Your function should include error checking Use your histogram function to estimate the PDF of the MATLAB PN (Pseudo- random Noise) generators. Include a single random-number seeding statement at the start of your main routine to avoid repeating the same experiment each time you run. . Generate at least 20000 numbers using the rand function. Call your histogram function to create an estimate for the PDF of this data set. Plot your PDF estimate from your main calling function (not the histogram function). Also, to generatea bar chart plot, the bar function is used in place of the normal plot command (alternatively, use the plot command and once the figure is displayed, click on the "Show Plot Tools and Dock Figure" icon last one in the list to bring up a suite of options concerning plot style including bar graphs, etc). Use at least 100 bins over the range-IS X 2 . You should set min =-1 and max= 2 in your call to your histogram function. Your bar plot should display from min1 to max = 2 . To do so, you will need to generate the x-axis data manually (ie., do not plot versus bin number). Do not shift/scale the rand function; the min and max values as given above are for plotting your data, not adjusting the rand function. Similar to the step above, generate at least 50000 numbers to create a histogram plot for the randn function, using at least 200 bins over the range -10s X s10 For rand PN generator, what distribution does your histogram best model? Answer the same question for the randn PN generator. . Create a new PN generator that is derived as the sum of 12 calls to the rand PN generator, i.e., 12 Generate at least 50000 values of this new random number XCompute and plot the histogram for Xnew. Choose a range -10s X S10 using at least 200 bins. What distribution does this new PN generator appear to have? How does this result relate to the Central Limit Theorem
Step by Step Solution
There are 3 Steps involved in it

Get step-by-step solutions from verified subject matter experts