

Question: - Coding language MatLab 2. Create a function called histogram that returns an array containing the histogram of a data set that is passed to
- Coding language MatLab
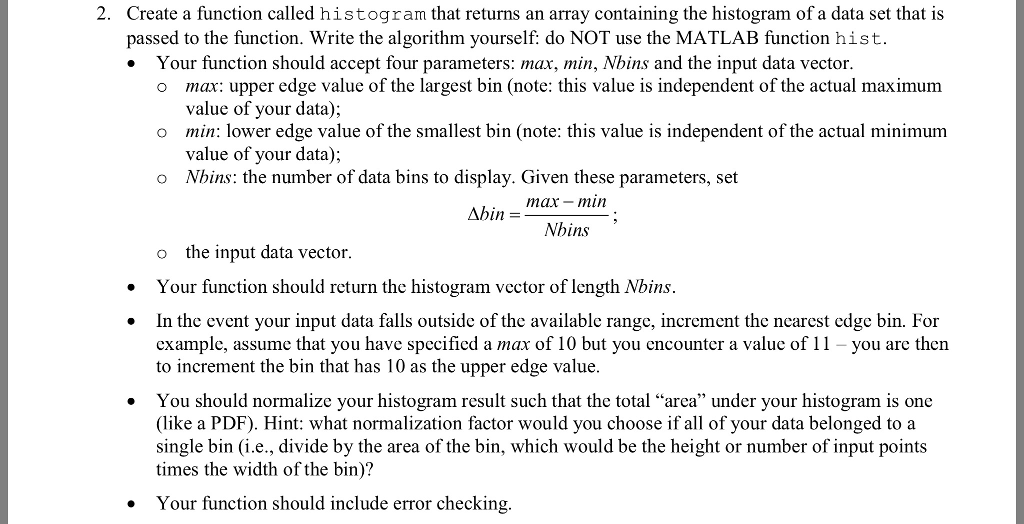
2. Create a function called histogram that returns an array containing the histogram of a data set that is passed to the function. Write the algorithm yourself: do NOT use the MATLAB function hist. * Your function should accept four parameters: max, min, Nbins and the input data vector. max: upper edge value of the largest bin (note: this value is independent of the actual maximum value of your data); o o min: lower edge value of the smallest bin (note: this value is independent of the actual minimunm value of your data); Nbins: the number of data bins to display. Given these parameters, set o max-min Abin-Nbins the input data vector. o Your function should return the histogram vector of length Nbins. In the event your input data falls outside of the available range, increment the ncarest edge bin. For cxample, assume that you have specified a max of 10 but you encounter a value of 11 - you are then to increment the bin that has 10 as the upper edge value . You should normalize your histogram result such that the total "area" under your histogram is one (like a PDF). Hint: what normalization factor would you choose if all of your data belonged to a single bin (i.e., divide by the area of the bin, which would be the height or number of input points times the width of the bin)? . Your function should include error checking. 2. Create a function called histogram that returns an array containing the histogram of a data set that is passed to the function. Write the algorithm yourself: do NOT use the MATLAB function hist. * Your function should accept four parameters: max, min, Nbins and the input data vector. max: upper edge value of the largest bin (note: this value is independent of the actual maximum value of your data); o o min: lower edge value of the smallest bin (note: this value is independent of the actual minimunm value of your data); Nbins: the number of data bins to display. Given these parameters, set o max-min Abin-Nbins the input data vector. o Your function should return the histogram vector of length Nbins. In the event your input data falls outside of the available range, increment the ncarest edge bin. For cxample, assume that you have specified a max of 10 but you encounter a value of 11 - you are then to increment the bin that has 10 as the upper edge value . You should normalize your histogram result such that the total "area" under your histogram is one (like a PDF). Hint: what normalization factor would you choose if all of your data belonged to a single bin (i.e., divide by the area of the bin, which would be the height or number of input points times the width of the bin)? . Your function should include error checking
Step by Step Solution
There are 3 Steps involved in it

Get step-by-step solutions from verified subject matter experts