Question: please write : schematic and sime theory and sample calculation , (table) Graph Reactions carried out in a CSTR eventually reach steady state when a
please write : schematic and sime theory and sample calculation , (table) Graph
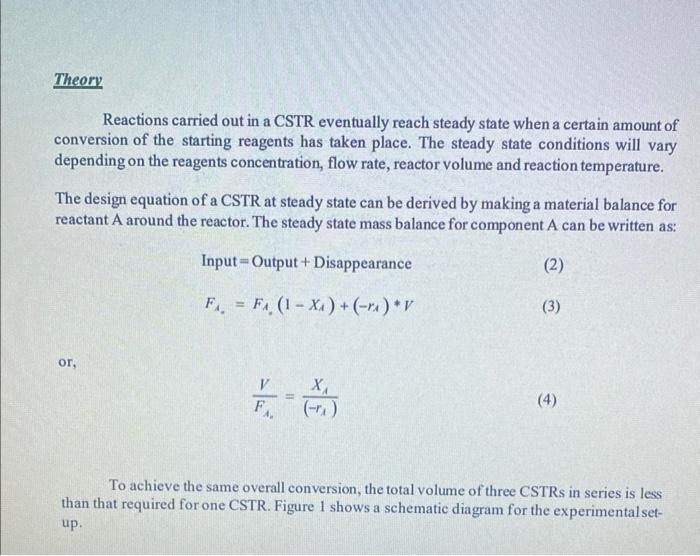
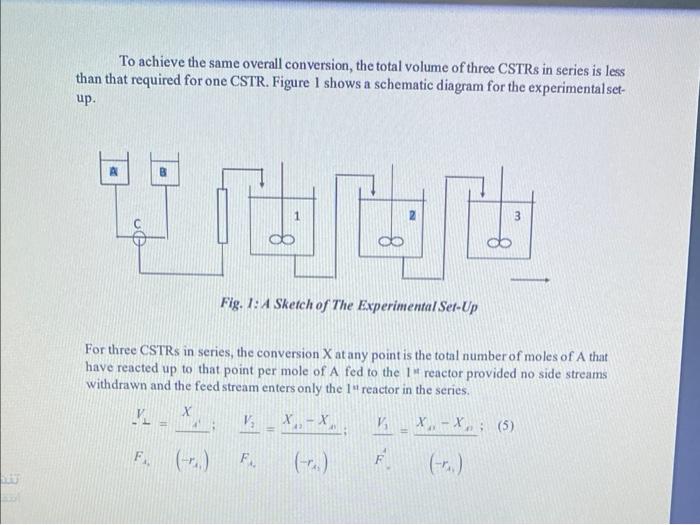
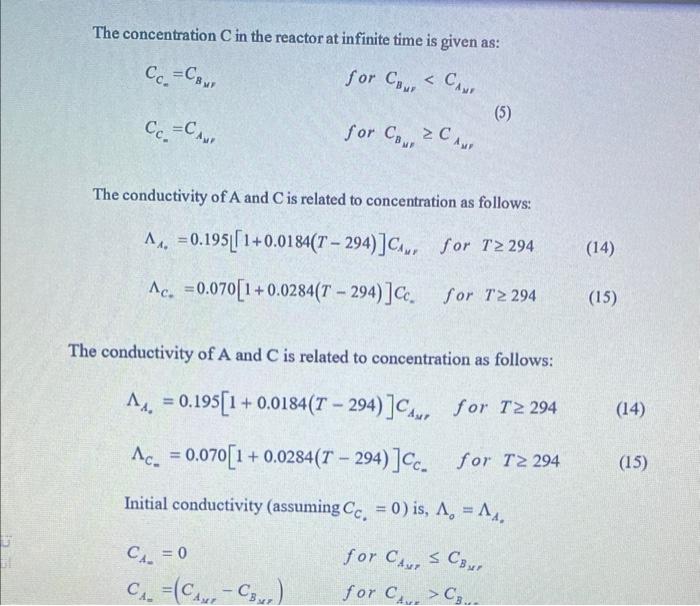
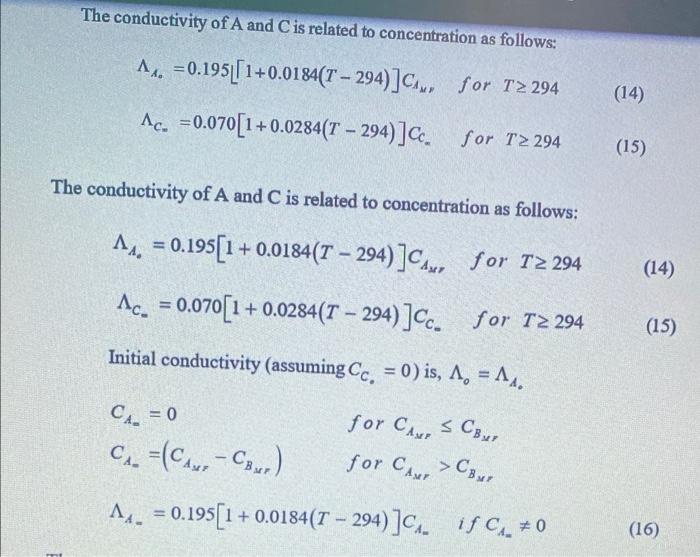
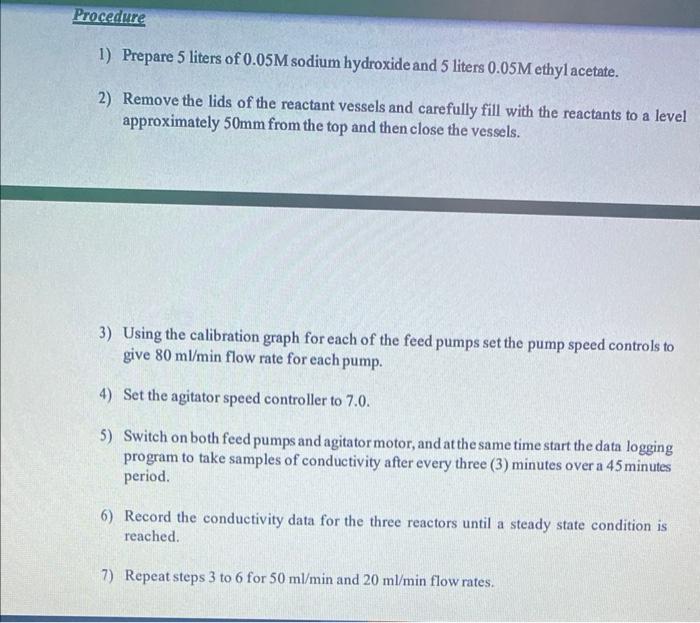
Reactions carried out in a CSTR eventually reach steady state when a certain amount of conversion of the starting reagents has taken place. The steady state conditions will vary depending on the reagents concentration, flow rate, reactor volume and reaction temperature. The design equation of a CSTR at steady state can be derived by making a material balance for reactant A around the reactor. The steady state mass balance for component A can be written as: Input=Output+DisappearanceFAA=FAA(1XA)+(rA)V or, FA0V=(rA)XA To achieve the same overall conversion, the total volume of three CSTRs in series is less than that required for one CSTR. Figure 1 shows a schematic diagram for the experimental setup. To achieve the same overall conversion, the total volume of three CSTRs in series is less than that required for one CSTR. Figure 1 shows a schematic diagram for the experimental setup. Fig. I: A Sketch of The ExperimentalSer-Up For three CSTRs in series, the conversion X at any point is the total number of moles of A that have reacted up to that point per mole of A fed to the 1 " reactor provided no side streams withdrawn and the feed stream enters only the 1" reactor in the series. FA+(rii)Fi.(rAi)F4(rAi) The concentration C in the reactor at infinite time is given as: CC=CBpforCBpCB The conductivity of A and C is related to concentration as follows: A0=0.195[[1+0.0184(T294)]CA,C=0.070[1+0.0284(T294)]CCforT294forT294 The conductivity of A and C is related to concentration as follows: A=0.195[1+0.0184(T294)]CAs,forT294C=0.070[1+0.0284(T294)]CCforT294 Initial conductivity (assuming CC=0 ) is, 0=A0 CA=0forCAxCBpCA=(CAs%CBsrr)forCAsr>CBsPA=0.195[1+0.0184(T294)]CAmifCAm=0 1) Prepare 5 liters of 0.05M sodium hydroxide and 5 liters 0.05M ethyl acetate. 2) Remove the lids of the reactant vessels and carefully fill with the reactants to a level approximately 50mm from the top and then close the vessels. 3) Using the calibration graph for each of the feed pumps set the pump speed controls to give 80ml/min flow rate for each pump. 4) Set the agitator speed controller to 7.0. 5) Switch on both feed pumps and agitator motor, and at the same time start the data logging program to take samples of conductivity after every three (3) minutes over a 45 minutes period. 6) Record the conductivity data for the three reactors until a steady state condition is reached. 7) Repeat steps 3 to 6 for 50ml/min and 20ml/min flow rates. Reactions carried out in a CSTR eventually reach steady state when a certain amount of conversion of the starting reagents has taken place. The steady state conditions will vary depending on the reagents concentration, flow rate, reactor volume and reaction temperature. The design equation of a CSTR at steady state can be derived by making a material balance for reactant A around the reactor. The steady state mass balance for component A can be written as: Input=Output+DisappearanceFAA=FAA(1XA)+(rA)V or, FA0V=(rA)XA To achieve the same overall conversion, the total volume of three CSTRs in series is less than that required for one CSTR. Figure 1 shows a schematic diagram for the experimental setup. To achieve the same overall conversion, the total volume of three CSTRs in series is less than that required for one CSTR. Figure 1 shows a schematic diagram for the experimental setup. Fig. I: A Sketch of The ExperimentalSer-Up For three CSTRs in series, the conversion X at any point is the total number of moles of A that have reacted up to that point per mole of A fed to the 1 " reactor provided no side streams withdrawn and the feed stream enters only the 1" reactor in the series. FA+(rii)Fi.(rAi)F4(rAi) The concentration C in the reactor at infinite time is given as: CC=CBpforCBpCB The conductivity of A and C is related to concentration as follows: A0=0.195[[1+0.0184(T294)]CA,C=0.070[1+0.0284(T294)]CCforT294forT294 The conductivity of A and C is related to concentration as follows: A=0.195[1+0.0184(T294)]CAs,forT294C=0.070[1+0.0284(T294)]CCforT294 Initial conductivity (assuming CC=0 ) is, 0=A0 CA=0forCAxCBpCA=(CAs%CBsrr)forCAsr>CBsPA=0.195[1+0.0184(T294)]CAmifCAm=0 1) Prepare 5 liters of 0.05M sodium hydroxide and 5 liters 0.05M ethyl acetate. 2) Remove the lids of the reactant vessels and carefully fill with the reactants to a level approximately 50mm from the top and then close the vessels. 3) Using the calibration graph for each of the feed pumps set the pump speed controls to give 80ml/min flow rate for each pump. 4) Set the agitator speed controller to 7.0. 5) Switch on both feed pumps and agitator motor, and at the same time start the data logging program to take samples of conductivity after every three (3) minutes over a 45 minutes period. 6) Record the conductivity data for the three reactors until a steady state condition is reached. 7) Repeat steps 3 to 6 for 50ml/min and 20ml/min flow rates