

Question: Please write the code in Python and answer the question. Plot the function f(x) = (1- x) - 1 and the function x at a
Please write the code in Python and answer the question.
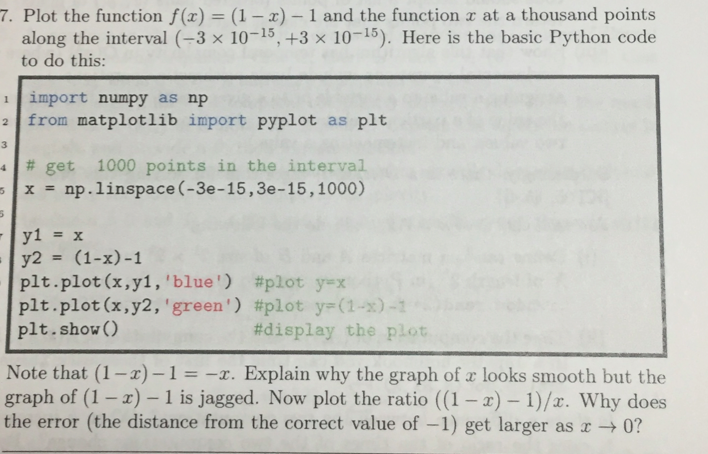
Plot the function f(x) = (1- x) - 1 and the function x at a thousand points along the interval (-3 times 10^-15, +3 times 10^-15). Here is the basic Python code to do this: import numpy as np from matplotlib import pyplot as plt # get 1000 points in the interval x = np.linspace (-3e-15, 3e-15, 1000) y_1 = x y_2 = (1 - x) - 1 plt.plot (x, y_1, 'blue') #plot y = x plt.plot (x, y2, 'green') #plot y = (1 - x) - 1 plt.show() #display the plot Note that (1 - x) - 1 = -x. Explain why the graph of x looks smooth but the graph of (1 - x) - 1 is jagged. Now plot the ratio ((1 - x) - 1)/x. Why does the error (the distance from the correct value of -1) get larger as x Rightarrow 0
Step by Step Solution
There are 3 Steps involved in it

Get step-by-step solutions from verified subject matter experts