

Question: please write the following code in matlab and is possble screen shot it or please provied me with the full code need it asap please
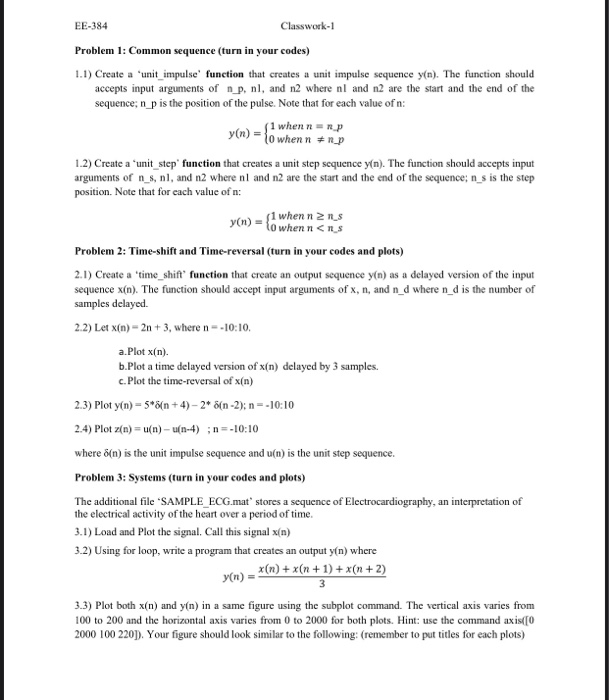
EE-384 Classwork-1 Problem 1: Common sequence (turn in your codes) 1.1) Create a "unit_impulse function that creates a unit impulse sequence y(n). The function should accepts input arguments of np, nl, and n2 where nl and n2 are the start and the end of the sequence, n_p is the position of the pulse. Note that for each value of n: 1 when n = Rp y(n) = 10 when #1_P 1.2) Create a 'unit_step' function that creates a unit step sequence y(n). The function should accepts input arguments of n_s, nl, and n2 where nl and n2 are the start and the end of the sequence; n_s is the step position. Note that for each value of n: yn) when nens to when ncn_s Problem 2: Time-shift and Time-reversal (turn in your codes and plots) 2.1) Create a "time_shift function that create an output sequence y(n) as a delayed version of the input sequence x(n). The function should accept input arguments of x, n, and n_d where n d is the number of samples delayed 2.2) Let x(n) - 2n + 3, where n--10:10. a.Plot xn). b.Plot a time delayed version of x(n) delayed by 3 samples. c. Plot the time-reversal of x(n) 2.3) Plot y(n) = 5*&(n + 4) - 2* o(n-2); n = -10:10 2.4) Plot (n)=(n)-un-4) in=-10:10 where on) is the unit impulse sequence and u(n) is the unit step sequence. Problem 3: Systems (turn in your codes and plots) The additional file.SAMPLE ECG.mat' stores a sequence of Electrocardiography, an interpretation of the electrical activity of the heart over a period of time. 3.1) Load and Plot the signal. Call this signal x(n) 3.2) Using for loop, write a program that creates an output y(n) where y(n) = _x(n) + x(n + 1) + x(n + 2) 3.3) Plot both x(n) and y(n) in a same figure using the subplot command. The vertical axis varies from 100 to 200 and the horizontal axis varies from 0 to 2000 for both plots. Hint: use the command axist[0 2000 100 220]). Your figure should look similar to the following: (remember to put titles for each plots) 3.4) Does y(n) look smoother than x(n)? You have just filtered the original signal using a low-pass filter The filter is supposed to remove high frequency components of the signal. Read: a) Direct form-Il implementation of a standard difference equation. b) Convolution of two diserete-time signals. c) Nyquist theorem
Step by Step Solution
There are 3 Steps involved in it

Get step-by-step solutions from verified subject matter experts