

Question: pleasee helpppp Below is the comparative income statement data for P. Donnelly, Inc. Prepare a comparative common-size income statement for P. Donnelly, Inc Round percentages
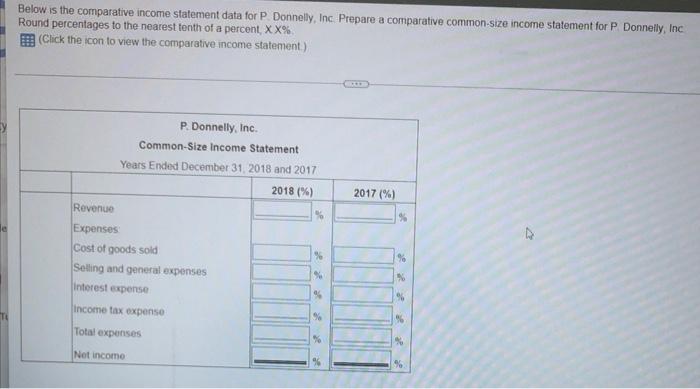
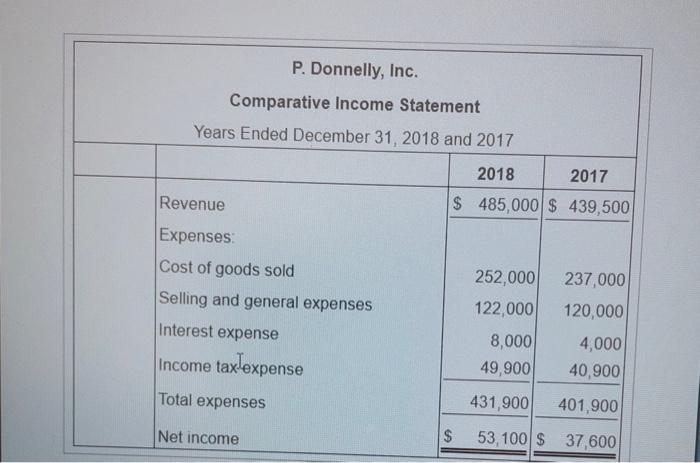
Below is the comparative income statement data for P. Donnelly, Inc. Prepare a comparative common-size income statement for P. Donnelly, Inc Round percentages to the nearest tenth of a percent, XX% (Click the icon to view the comparative income statement) P. Donnelly, Inc. Common-Size Income Statement Years Ended December 31, 2018 and 2017 2018 (%) 2017 (%) Revenue Expenses Cost of goods sold Selling and general expenses interest expense Income tax expense Total expenses Net income % ge R % P. Donnelly, Inc. Comparative Income Statement Years Ended December 31, 2018 and 2017 2018 2017 Revenue $ 485,000 $ 439,500 Expenses: Cost of goods sold 252,000 237,000 Selling and general expenses 122,000 120,000 Interest expense 8,000 4,000 Income tax expense 49,900 40,900 Total expenses 431,900 401,900 $ 53,100 $ 37,600 Net income
Step by Step Solution
There are 3 Steps involved in it

Get step-by-step solutions from verified subject matter experts