

Question: PLESE show work I'll like the post Consider an order handling process with different causes of errors and the corresponding frequencies as in the table
PLESE show work I'll like the post
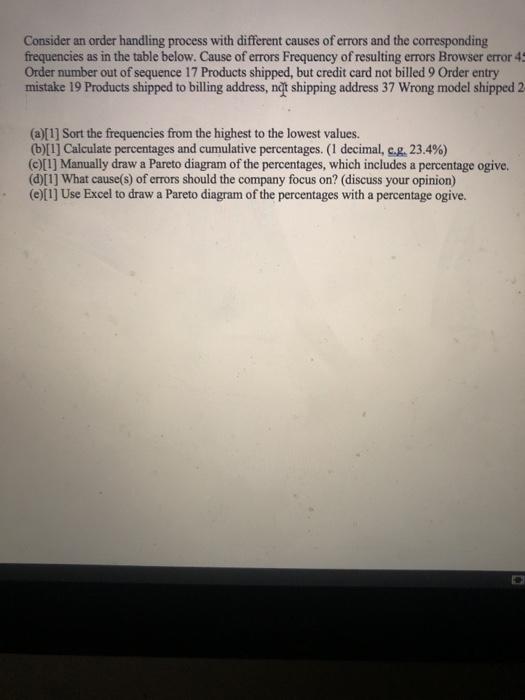
Consider an order handling process with different causes of errors and the corresponding frequencies as in the table below. Cause of errors Frequency of resulting errors Browser error 4 Order number out of sequence 17 Products shipped, but credit card not billed 9 Order entry mistake 19 Products shipped to billing address, ndt shipping address 37 Wrong model shipped 2 (2)[1] Sort the frequencies from the highest to the lowest values. (b)[1] Calculate percentages and cumulative percentages. (I decimal, c.g. 23.4%) [l] Manually draw a Pareto diagram of the percentages, which includes a percentage ogive. (d)[1] What cause(s) of errors should the company focus on? (discuss your opinion) [1] Use Excel to draw a Pareto diagram of the percentages with a percentage ogive. Consider an order handling process with different causes of errors and the corresponding frequencies as in the table below. Cause of errors Frequency of resulting errors Browser error 4 Order number out of sequence 17 Products shipped, but credit card not billed 9 Order entry mistake 19 Products shipped to billing address, ndt shipping address 37 Wrong model shipped 2 (2)[1] Sort the frequencies from the highest to the lowest values. (b)[1] Calculate percentages and cumulative percentages. (I decimal, c.g. 23.4%) [l] Manually draw a Pareto diagram of the percentages, which includes a percentage ogive. (d)[1] What cause(s) of errors should the company focus on? (discuss your opinion) [1] Use Excel to draw a Pareto diagram of the percentages with a percentage ogive Step by Step Solution
There are 3 Steps involved in it
1 Expert Approved Answer
Step: 1 Unlock

Question Has Been Solved by an Expert!
Get step-by-step solutions from verified subject matter experts
Step: 2 Unlock
Step: 3 Unlock