

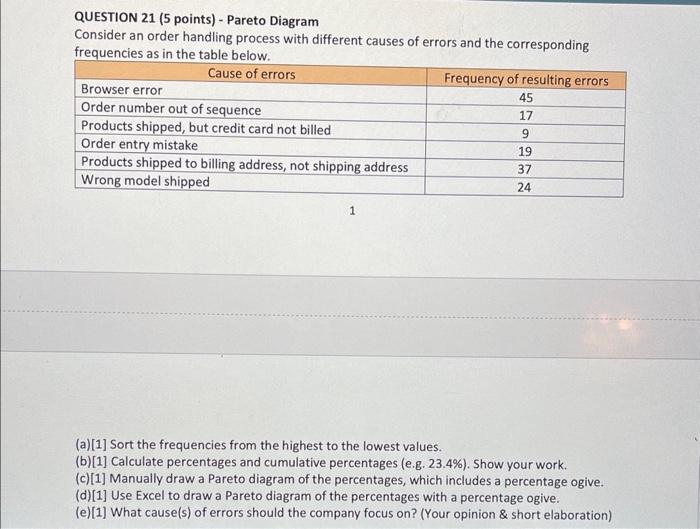
Question: QUESTION 21 (5 points) - Pareto Diagram Consider an order handling process with different causes of errors and the corresponding frequencies as in the table
Step by Step Solution
There are 3 Steps involved in it
1 Expert Approved Answer
Step: 1 Unlock

Question Has Been Solved by an Expert!
Get step-by-step solutions from verified subject matter experts
Step: 2 Unlock
Step: 3 Unlock