

Question: Plot a graph, similar to the one below, with the new variables (1)/(T) on the x -axis and LnP on the y -axis. Use the
Plot a graph, similar to the one below, with the new variables
(1)/(T)on the
x-axis and
LnPon the
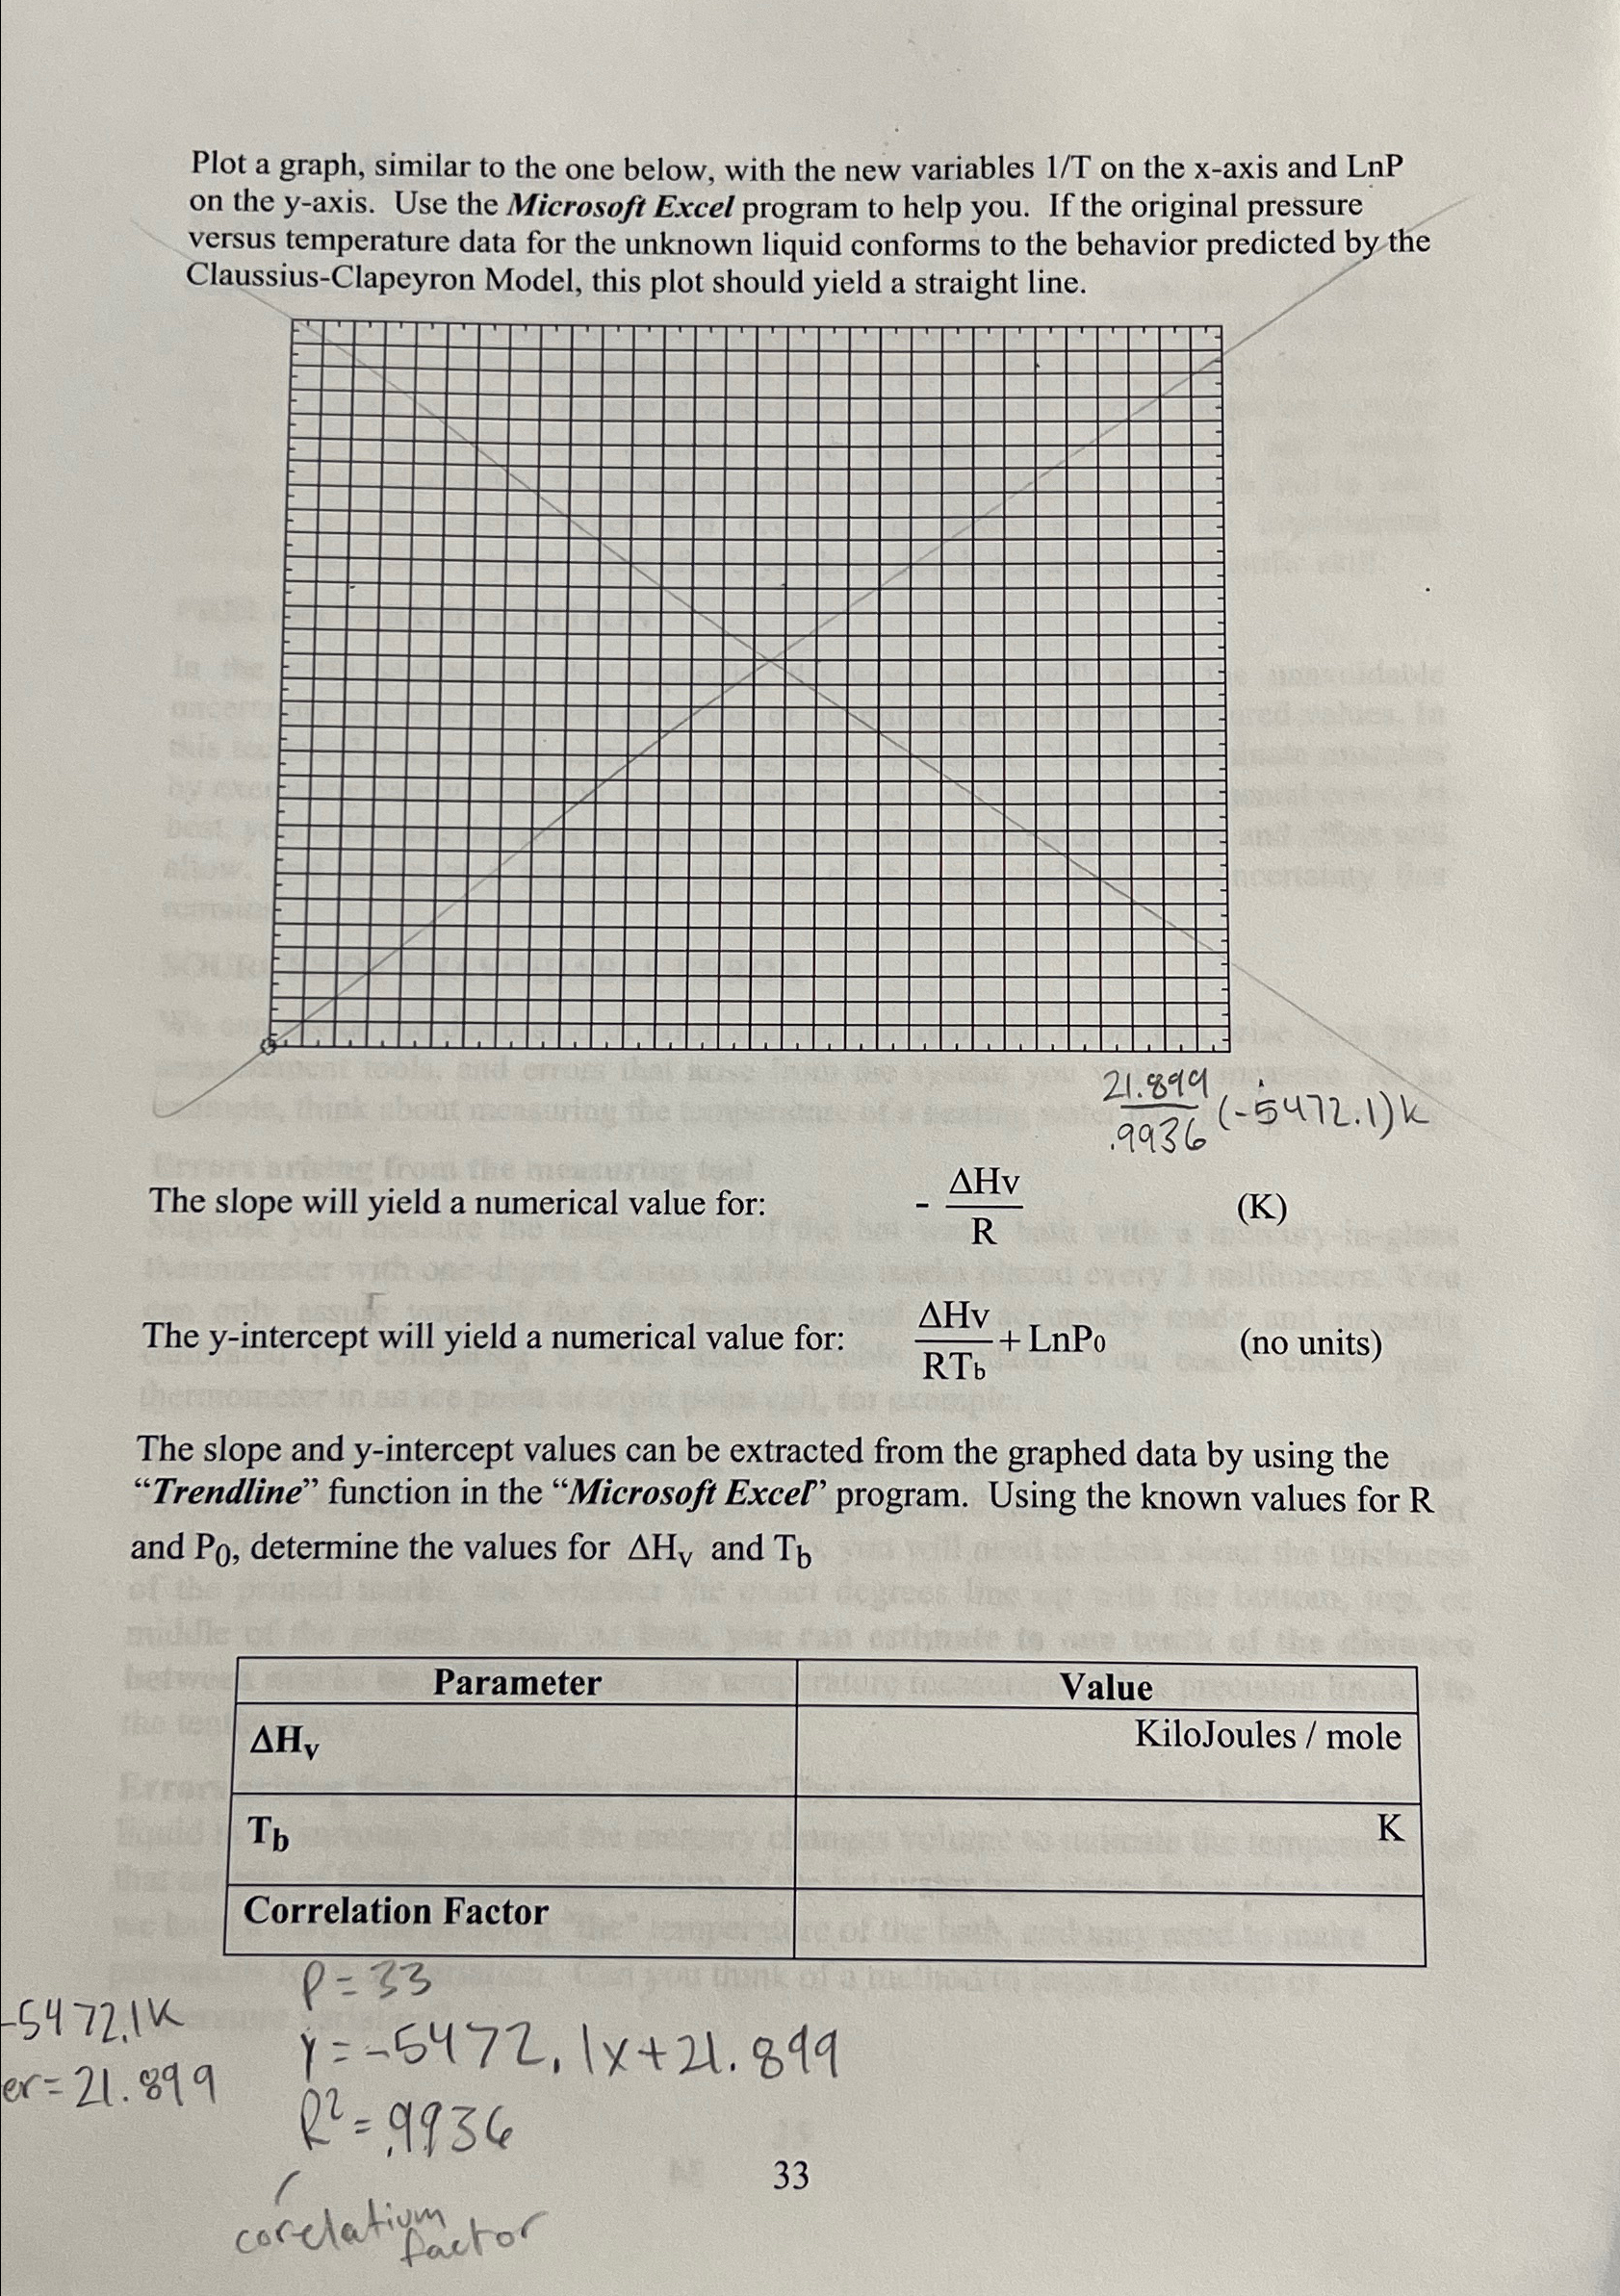
y-axis. Use the Microsoft Excel program to help you. If the original pressure versus temperature data for the unknown liquid conforms to the behavior predicted by the Claussius-Clapeyron Model, this plot should yield a straight line.\
(4.0*1)/(.9936)(-5472.1)k\ The slope will yield a numerical value for:\
-(\\\\Delta Hv)/(R)\ (K)\ The y-intercept will yield a numerical value for:
(\\\\Delta Hv)/(RT_(b))+LnP_(0),(no units)\ The slope and y-intercept values can be extracted from the graphed data by using the "Trendline" function in the "Microsoft Excel" program. Using the known values for R and
P_(0), determine the values for
\\\\Delta H_(V)and
T_(b)\ \\\\table[[Parameter,Value],[
\\\\Delta H_(v),KiloJoules / mole],[
T_(b),],[Correlation Factor,]]\
-5472.1K\
er=21.899\
P=33\ y=-5472,1x+21.899\ R^(2)=.9936\ 33
Plot a graph, similar to the one below, with the new variables 1/T on the x-axis and LnP on the y-axis. Use the Microsoft Excel program to help you. If the original pressure versus temperature data for the unknown liquid conforms to the behavior predicted by the Claussius-Clapeyron Model, this plot should yield a straight line. .993621.894(5472.1)k The slope will yield a numerical value for: RHv (K) The y-intercept will yield a numerical value for: RTbHv+LnP0 (no units) The slope and y-intercept values can be extracted from the graphed data by using the "Trendline" function in the "Microsoft Excel" program. Using the known values for R and P0, determine the values for Hv and Tb 2.1K 1.899 y=5472,1x+21.899R2=.9936 Plot a graph, similar to the one below, with the new variables 1/T on the x-axis and LnP on the y-axis. Use the Microsoft Excel program to help you. If the original pressure versus temperature data for the unknown liquid conforms to the behavior predicted by the Claussius-Clapeyron Model, this plot should yield a straight line. .993621.894(5472.1)k The slope will yield a numerical value for: RHv (K) The y-intercept will yield a numerical value for: RTbHv+LnP0 (no units) The slope and y-intercept values can be extracted from the graphed data by using the "Trendline" function in the "Microsoft Excel" program. Using the known values for R and P0, determine the values for Hv and Tb 2.1K 1.899 y=5472,1x+21.899R2=.9936
Step by Step Solution
There are 3 Steps involved in it

Get step-by-step solutions from verified subject matter experts