

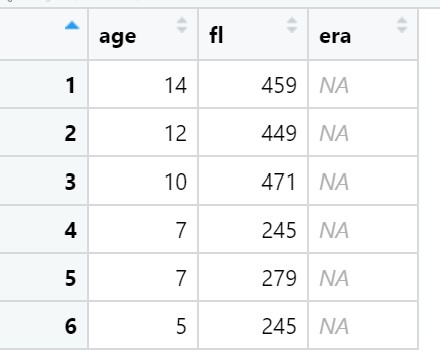
Question: Plot a regression line of the previous plot with a dashed line with width 2 and color cadetblue. The x-axis is age, and the y-axis
Plot a regression line of the previous plot with a dashed line with width 2 and color
"cadetblue".
The x-axis is age, and the y-axis is fl. the data is shown in the figure.
Please show the code of the project and solve it in R language?
Step by Step Solution
There are 3 Steps involved in it
1 Expert Approved Answer
Step: 1 Unlock

Question Has Been Solved by an Expert!
Get step-by-step solutions from verified subject matter experts
Step: 2 Unlock
Step: 3 Unlock