

Question: Plot all the Price Returns time series in the same graph. Interpret. (I SOLVED THE Q, I WANT TO MAKE SURE IF THE ANSWER IS
- Plot all the Price Returns time series in the same graph. Interpret. (I SOLVED THE Q, I WANT TO MAKE SURE IF THE ANSWER IS CORRECT OR NOT)
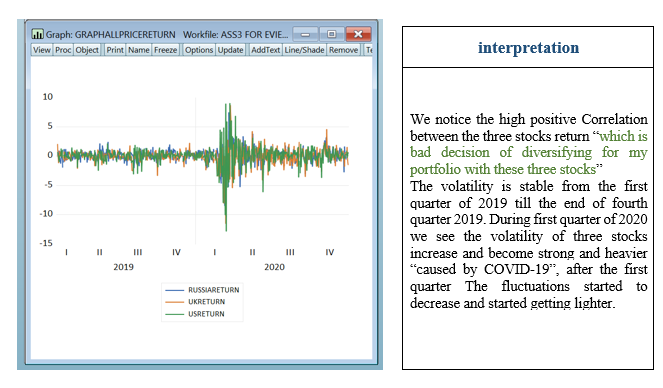
Graph: GRAPHALLPRICERETURN Workfile: ASS3 FOR EVIE. View Proc Object Print Name Freeze Options Update AddText Line/Shade Remove | Te interpretation 10 5 0 -5 -10 We notice the high positive correlation between the three stocks return " which is bad decision of diversifying for my portfolio with these three stocks The volatility is stable from the first quarter of 2019 till the end of fourth quarter 2019. During first quarter of 2020 we see the volatility of three stocks increase and become strong and heavier "caused by COVID-19", after the first quarter The fluctuations started to decrease and started getting lighter. - 15 1 11 = IV I II IV III 2019 III 2020 RUSSIARETURN UKRETURN USRETURN
Step by Step Solution
There are 3 Steps involved in it

Get step-by-step solutions from verified subject matter experts