

Question: plot and analyse the data given in table 1 above. recommend a forecasting model to Nkosinathi which he can use to predict the number of
plot and analyse the data given in table 1 above. recommend a forecasting model to Nkosinathi which he can use to predict the number of cases to be sold in the upcoming 6 or 12 months. also, justify why you have recommended this model.
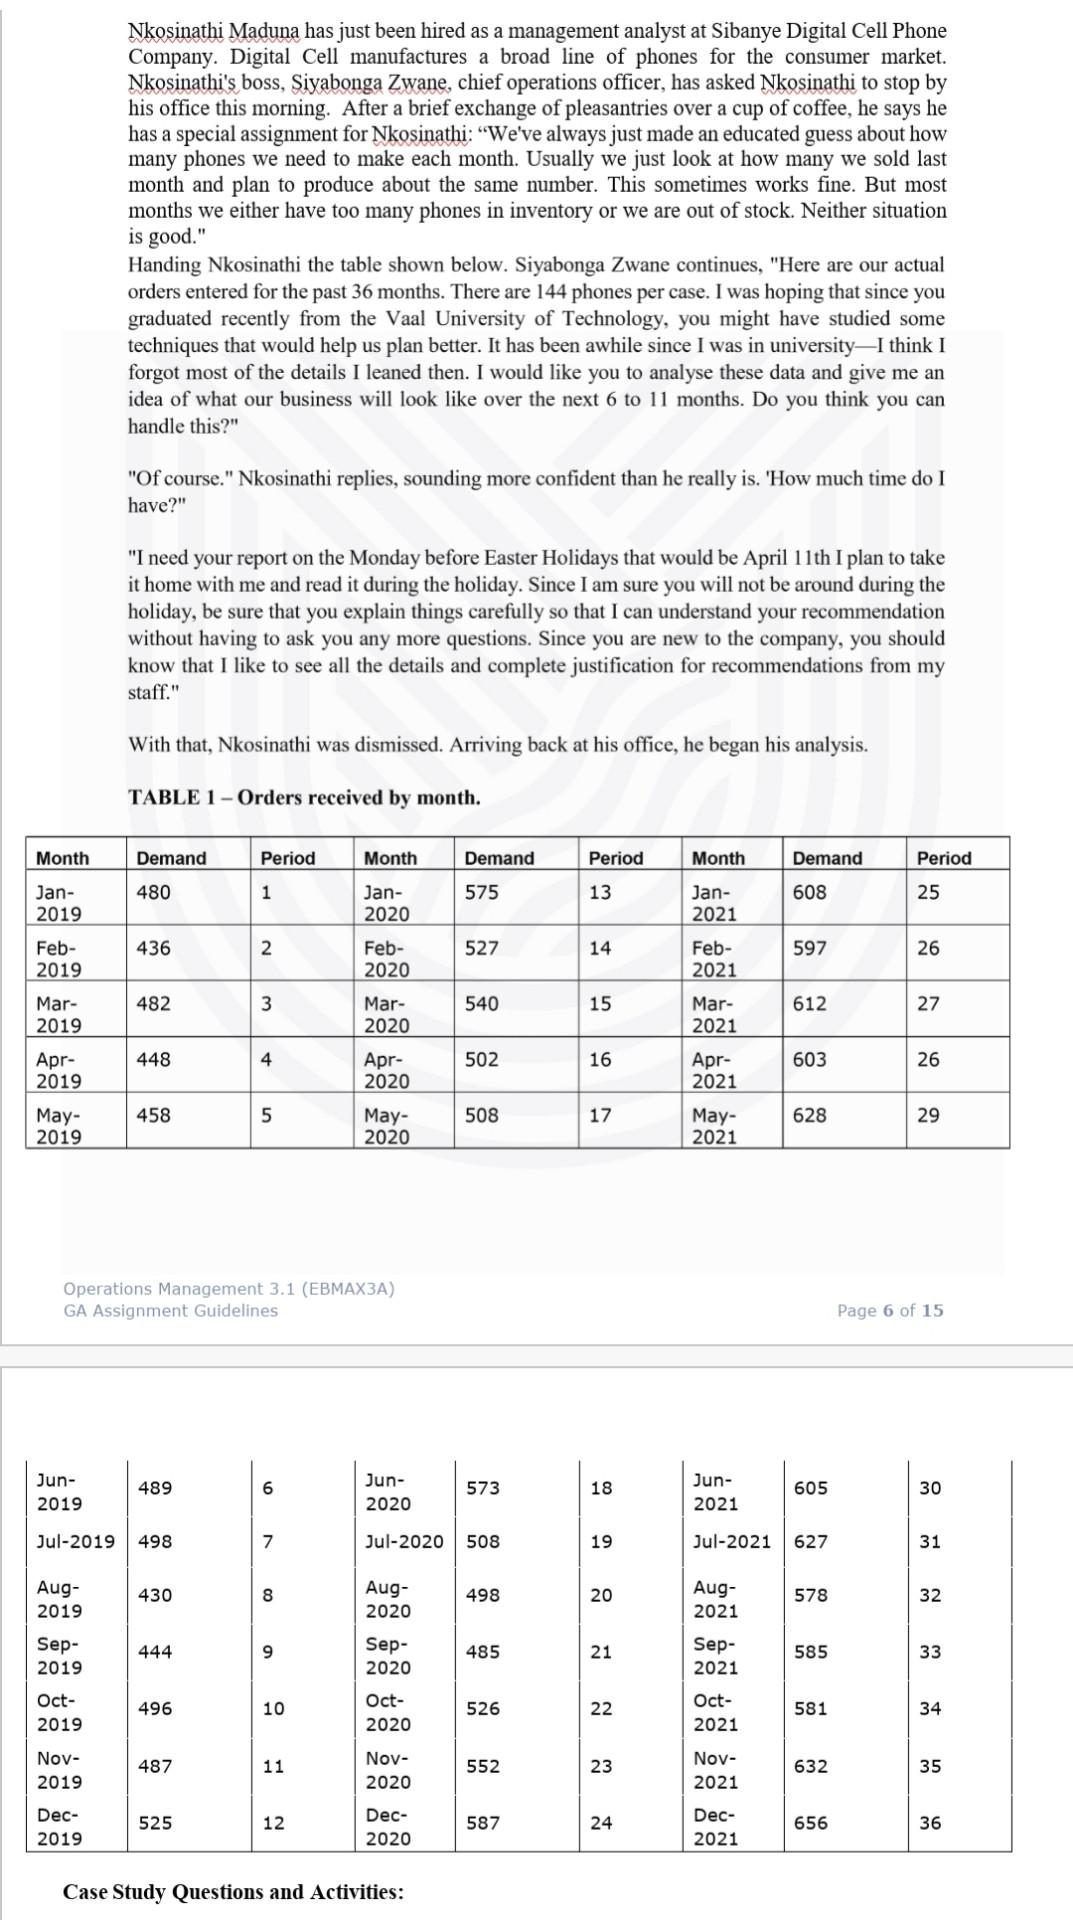
Nkosinathi Maduna has just been hired as a management analyst at Sibanye Digital Cell Phone Company. Digital Cell manufactures a broad line of phones for the consumer market. Nkosinathi's boss, Siyabonga Zwane, chief operations officer, has asked Nkosinathi to stop by his office this morning. After a brief exchange of pleasantries over a cup of coffee, he says he has a special assignment for Nkosinathi: "We've always just made an educated guess about how many phones we need to make each month. Usually we just look at how many we sold last month and plan to produce about the same number. This sometimes works fine. But most months we either have too many phones in inventory or we are out of stock. Neither situation is good." Handing Nkosinathi the table shown below. Siyabonga Zwane continues, "Here are our actual orders entered for the past 36 months. There are 144 phones per case. I was hoping that since you graduated recently from the Vaal University of Technology, you might have studied some techniques that would help us plan better. It has been awhile since I was in university-I think I forgot most of the details I leaned then. I would like you to analyse these data and give me an idea of what our business will look like over the next 6 to 11 months. Do you think you can handle this?" "Of course." Nkosinathi replies, sounding more confident than he really is. 'How much time do I have?" "I need your report on the Monday before Easter Holidays that would be April 11th I plan to take it home with me and read it during the holiday. Since I am sure you will not be around during the holiday, be sure that you explain things carefully so that I can understand your recommendation without having to ask you any more questions. Since you are new to the company, you should know that I like to see all the details and complete justification for recommendations from my staff." With that, Nkosinathi was dismissed. Arriving back at his office, he began his analysis. TABLE 1-Orders received by month. Month Demand Period Month Demand Period Month Demand Jan- 480 1 Jan- 575 13 Jan- 608 2019 2020 2021 Feb- 436 2 Feb- 527 14 Feb- 597 2019 2020 2021 Mar- 482 3 Mar- 540 15 Mar- 612 2019 2020 2021 Apr- 448 4 Apr- 502 16 Apr- 603 2019 2020 2021 May- 458 5 May- 508 17 May- 628 2019 2020 2021 Operations Management 3.1 (EBMAX3A) GA Assignment Guidelines Jun- Jun- 489 6 18 2019 2020 Jul-2019 498 7 Jul-2020 19 Aug- Aug- 430 8 20 2019 2020 Sep- Sep- 444 9 21 2019 2020 Oct- Oct- 496 10 22 2019 2020 Nov- Nov- 487 11 23 2019 2020 Dec- Dec- 525 12 24 2019 2020 Case Study Questions and Activities: 573 508 498 485 526 552 587 Jun- 2021 605 Jul-2021 627 Aug- 578 2021 Sep- 585 2021 Oct- 581 2021 Nov- 632 2021 Dec- 656 2021 Period 25 26 27 26 29 Page 6 of 15 30 31 32 33 34 35 36
Step by Step Solution
There are 3 Steps involved in it
1 Expert Approved Answer
Step: 1 Unlock

Question Has Been Solved by an Expert!
Get step-by-step solutions from verified subject matter experts
Step: 2 Unlock
Step: 3 Unlock