

Question: plot and analysis the data given in table 1 above. recommend a forecasting model to Nkosinathi which he can use to predict the number of
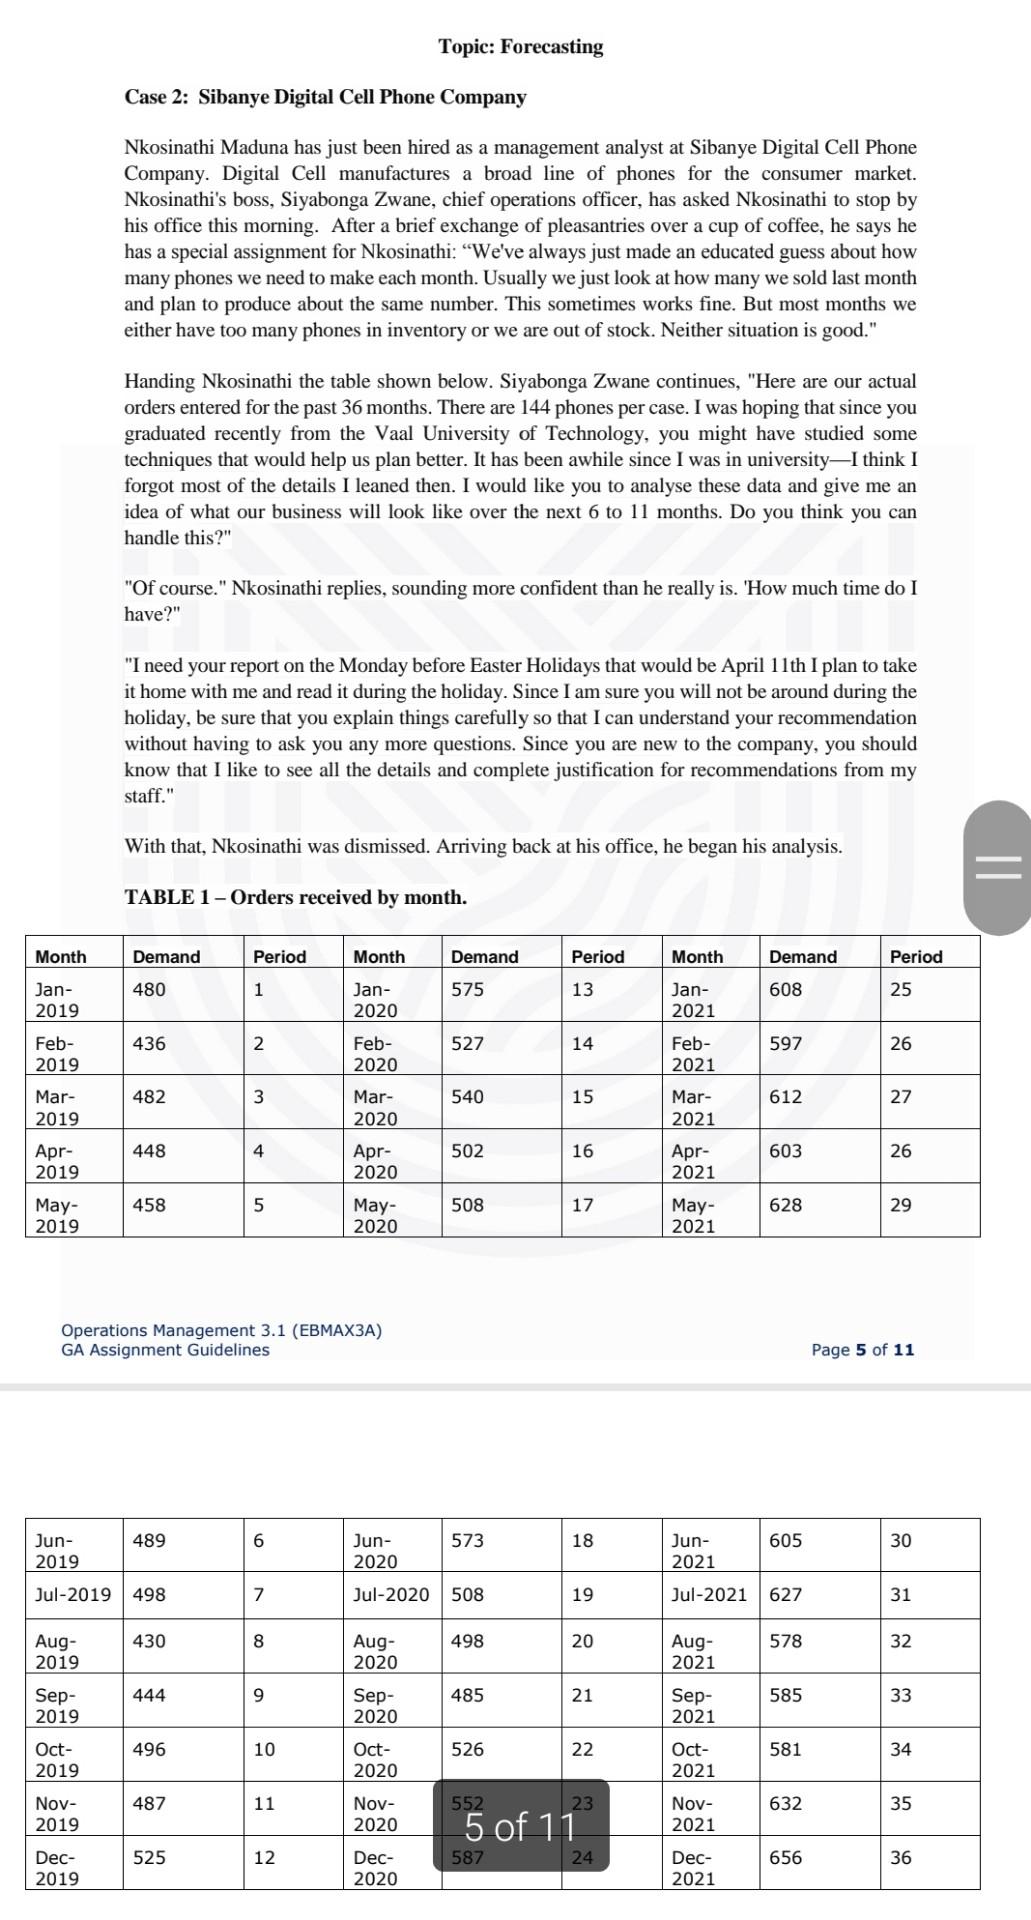
plot and analysis the data given in table 1 above. recommend a forecasting model to Nkosinathi which he can use to predict the number of cases to be sold in the upcoming 6 or 12 months. also justify why you recommended this model
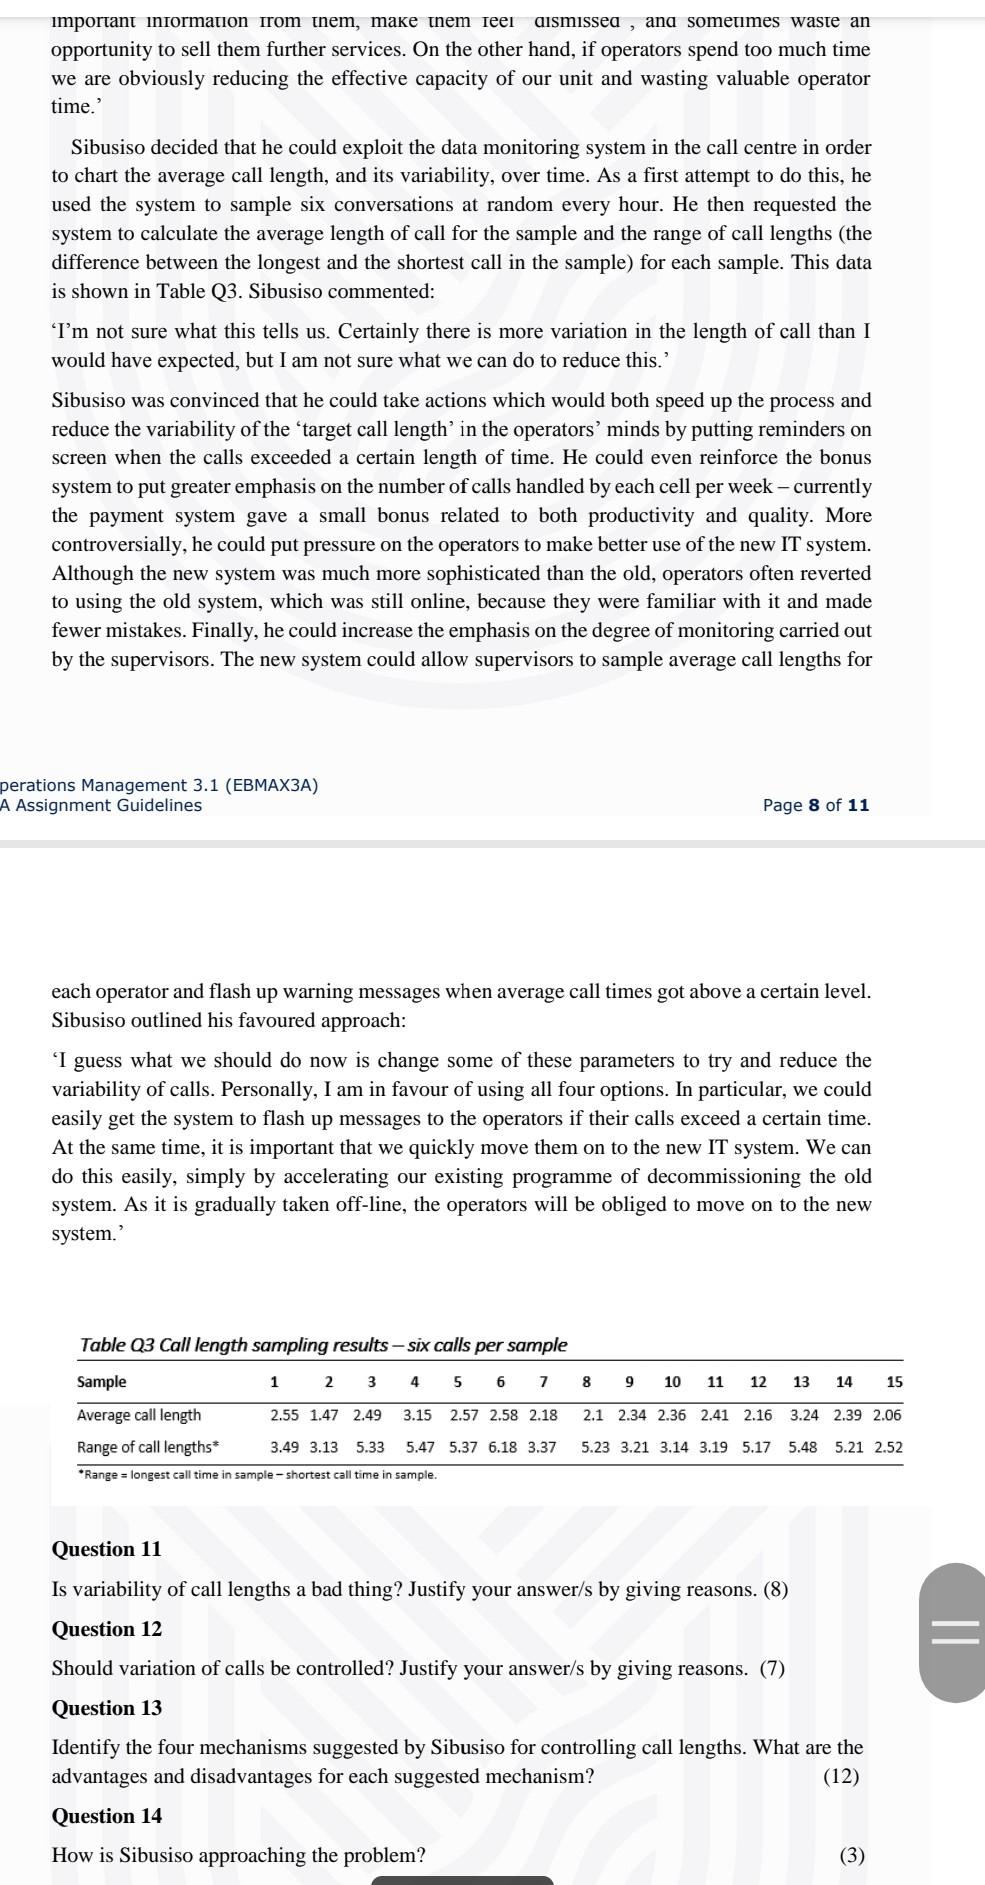
important information from tnem, make tnem reel aismissea, and sometimes waste an opportunity to sell them further services. On the other hand, if operators spend too much time we are obviously reducing the effective capacity of our unit and wasting valuable operator time.' Sibusiso decided that he could exploit the data monitoring system in the call centre in order to chart the average call length, and its variability, over time. As a first attempt to do this, he used the system to sample six conversations at random every hour. He then requested the system to calculate the average length of call for the sample and the range of call lengths (the difference between the longest and the shortest call in the sample) for each sample. This data is shown in Table Q3. Sibusiso commented: 'I'm not sure what this tells us. Certainly there is more variation in the length of call than I would have expected, but I am not sure what we can do to reduce this.' Sibusiso was convinced that he could take actions which would both speed up the process and reduce the variability of the 'target call length' in the operators' minds by putting reminders on screen when the calls exceeded a certain length of time. He could even reinforce the bonus system to put greater emphasis on the number of calls handled by each cell per week - currently the payment system gave a small bonus related to both productivity and quality. More controversially, he could put pressure on the operators to make better use of the new IT system. Although the new system was much more sophisticated than the old, operators often reverted to using the old system, which was still online, because they were familiar with it and made fewer mistakes. Finally, he could increase the emphasis on the degree of monitoring carried out by the supervisors. The new system could allow supervisors to sample average call lengths for perations Management 3.1 (EBMAX3A) A Assignment Guidelines Page 8 of 11 each operator and flash up warning messages when average call times got above a certain level. Sibusiso outlined his favoured approach: 'I guess what we should do now is change some of these parameters to try and reduce the variability of calls. Personally, I am in favour of using all four options. In particular, we could easily get the system to flash up messages to the operators if their calls exceed a certain time. At the same time, it is important that we quickly move them on to the new IT system. We can do this easily, simply by accelerating our existing programme of decommissioning the old system. As it is gradually taken off-line, the operators will be obliged to move on to the new system.' Table Q3 Call length sampling results-six calls per sample Sample 1 2 3 4 5 6 7 2.55 1.47 2.49 3.15 2.57 2.58 2.18 Average call length Range of call lengths* 8 9 10 12 13 14 15 2.1 2.34 2.36 2.41 2.16 3.24 2.39 2.06 5.23 3.21 3.14 3.19 5.17 5.48 5.21 2.52 3.49 3.13 5.33 5.47 5.37 6.18 3.37 *Range = longest call time in sample-shortest call time in sample. Question 11 Is variability of call lengths a bad thing? Justify your answer/s by giving reasons. (8) Question 12 Should variation of calls be controlled? Justify your answer/s by giving reasons. (7) Question 13 Identify the four mechanisms suggested by Sibusiso for controlling call lengths. What are the advantages and disadvantages for each suggested mechanism? (12) Question 14 How is Sibusiso approaching the problem? (3) Topic: Forecasting Case 2: Sibanye Digital Cell Phone Company Nkosinathi Maduna has just been hired as a management analyst at Sibanye Digital Cell Phone Company. Digital Cell manufactures a broad line of phones for the consumer market. Nkosinathi's boss, Siyabonga Zwane, chief operations officer, has asked Nkosinathi to stop by his office this morning. After a brief exchange of pleasantries over a cup of coffee, he says he has a special assignment for Nkosinathi: "We've always just made an educated guess about how many phones we need to make each month. Usually we just look at how many we sold last month and plan to produce about the same number. This sometimes works fine. But most months we either have too many phones in inventory or we are out of stock. Neither situation is good." Handing Nkosinathi the table shown below. Siyabonga Zwane continues, "Here are our actual orders entered for the past 36 months. There are 144 phones per case. I was hoping that since you graduated recently from the Vaal University of Technology, you might have studied some techniques that would help us plan better. It has been awhile since I was in university-I think I forgot most of the details I leaned then. I would like you to analyse these data and give me an idea of what our business will look like over the next 6 to 11 months. Do you think you can handle this?" "Of course." Nkosinathi replies, sounding more confident than he really is. 'How much time do I have?" "I need your report on the Monday before Easter Holidays that would be April 11th I plan to take it home with me and read it during the holiday. Since I am sure you will not be around during the holiday, be sure that you explain things carefully so that I can understand your recommendation without having to ask you any more questions. Since you are new to the company, you should know that I like to see all the details and complete justification for recommendations from my staff." With that, Nkosinathi was dismissed. Arriving back at his office, he began his analysis. TABLE 1-Orders received by month. Month Demand Period Month Demand Period Month Demand Jan- 480 1 Jan- 575 13 Jan- 608 2019 2020 2021 Feb- 436 2 Feb- 527 14 Feb- 597 2019 2020 2021 Mar- 482 3 Mar- 540 15 Mar- 612 2019 2020 2021 Apr- 448 4 Apr- 502 16 Apr- 603 2019 2020 2021 May- 458 5 May- 508 17 May- 628 2019 2020 2021 Operations Management 3.1 (EBMAX3A) GA Assignment Guidelines 489 6 573 18. Jun- 2019 Jun- 2020 Jul-2019 498 7 Jul-2020 508 19 Aug- 430 8 Aug- 498 20 2019 2020 Sep- 444 9 Sep- 485 21 2019 2020 Oct- 496 10 Oct- 526 22 2019 2020 Nov- 487 11 Nov- 552 23 2019 2020 Dec- 525 12 Dec- 2019 2020 5 of 11 587 24 Jun- 605 2021 Jul-2021 627 Aug- 578 2021 Sep- 585 2021 Oct- 581 2021 Nov- 632 2021 Dec- 656 2021 Period 25 26 27 26 29 Page 5 of 11 30 31 32 33 34 35 36Step by Step Solution
There are 3 Steps involved in it
1 Expert Approved Answer
Step: 1 Unlock

Question Has Been Solved by an Expert!
Get step-by-step solutions from verified subject matter experts
Step: 2 Unlock
Step: 3 Unlock