

Question: Plot and label theconstraints C,, C2 and C3 (using the line drawing tool) on the provided graph. 2.) Using the point drawing tool, plot the
Plot and label theconstraints C,, C2 and C3 (using the line drawing tool) on the provided graph.
2.) Using the point drawing tool, plot the point that maximizes theobjective function.
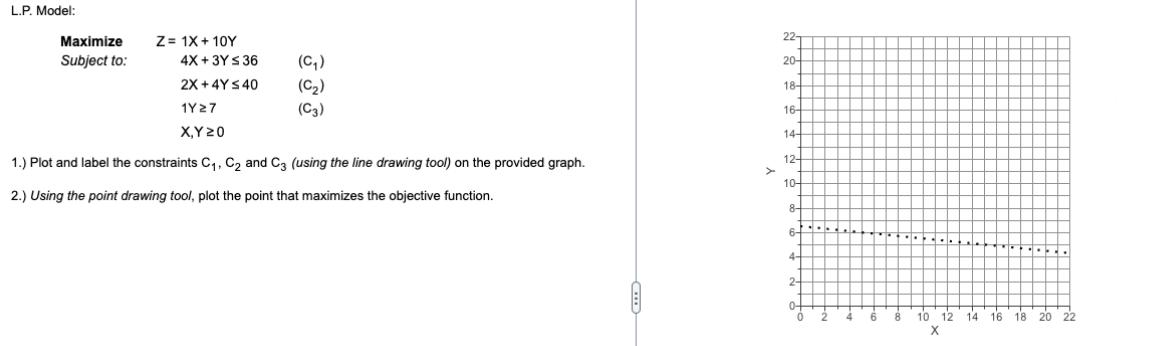
L.P. Model: Maximize Subject to: Z= 1X + 10Y 4X+3Y 36 2X+4Y 40 1Y27 X,Y 20 1.) Plot and label the constraints C, C and C3 (using the line drawing tool) on the provided graph. 2.) Using the point drawing tool, plot the point that maximizes the objective function. (C) (C) (C3) 227 20- 18- 16- 14- 12- 104 8- 6- 4- 24 2 4 6 8 10 12 14 16 18 20 22 X
Step by Step Solution
There are 3 Steps involved in it
1 Expert Approved Answer
Step: 1 Unlock

Question Has Been Solved by an Expert!
Get step-by-step solutions from verified subject matter experts
Step: 2 Unlock
Step: 3 Unlock