

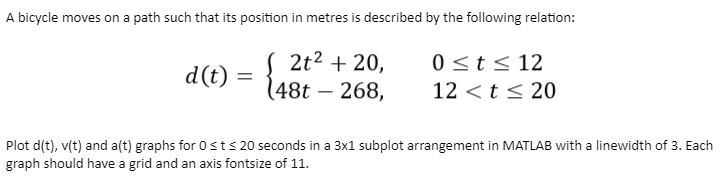
Question: Plot d ( t ) , v ( t ) and a ( t ) graphs for 0 t 2 0 seconds in a 3
Plot and graphs for seconds in a subplot arrangement in MATLAB with a linewidth of Each
graph should have a grid and an axis fontsize of
Step by Step Solution
There are 3 Steps involved in it
1 Expert Approved Answer
Step: 1 Unlock

Question Has Been Solved by an Expert!
Get step-by-step solutions from verified subject matter experts
Step: 2 Unlock
Step: 3 Unlock