

Question: Thank you very much, still learning MATLAB Tutorial on musical frequencies: An octave consists of 12 notes between C and the next C. On the
Thank you very much, still learning MATLAB
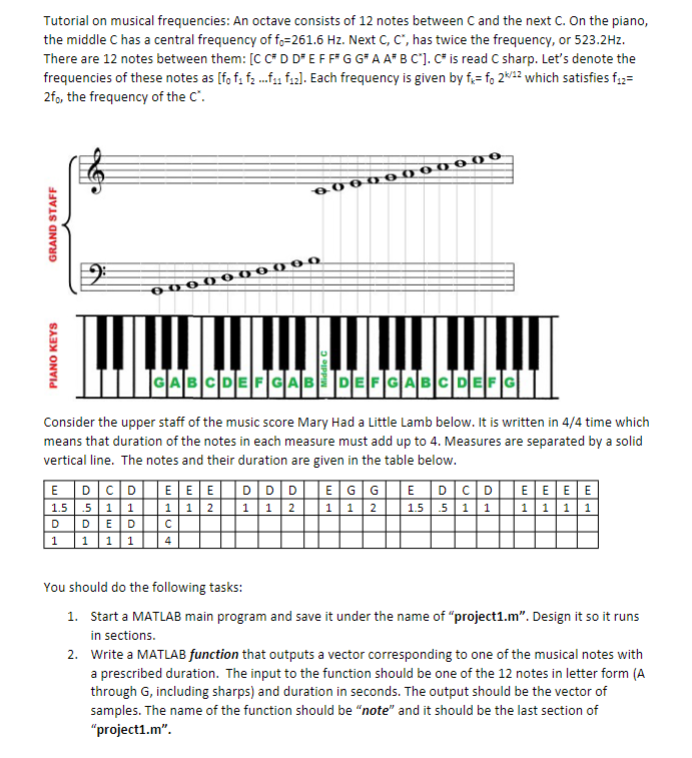
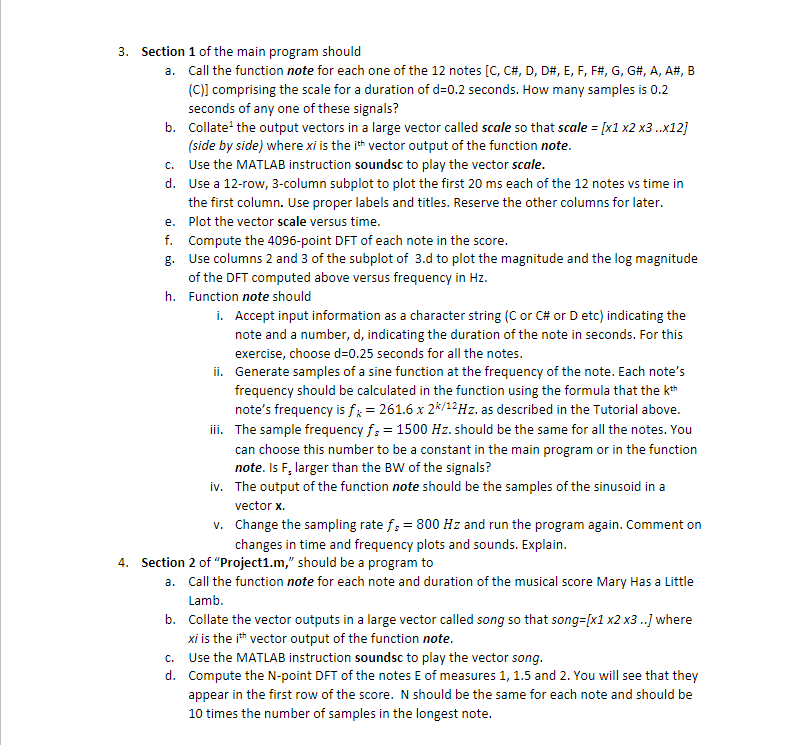
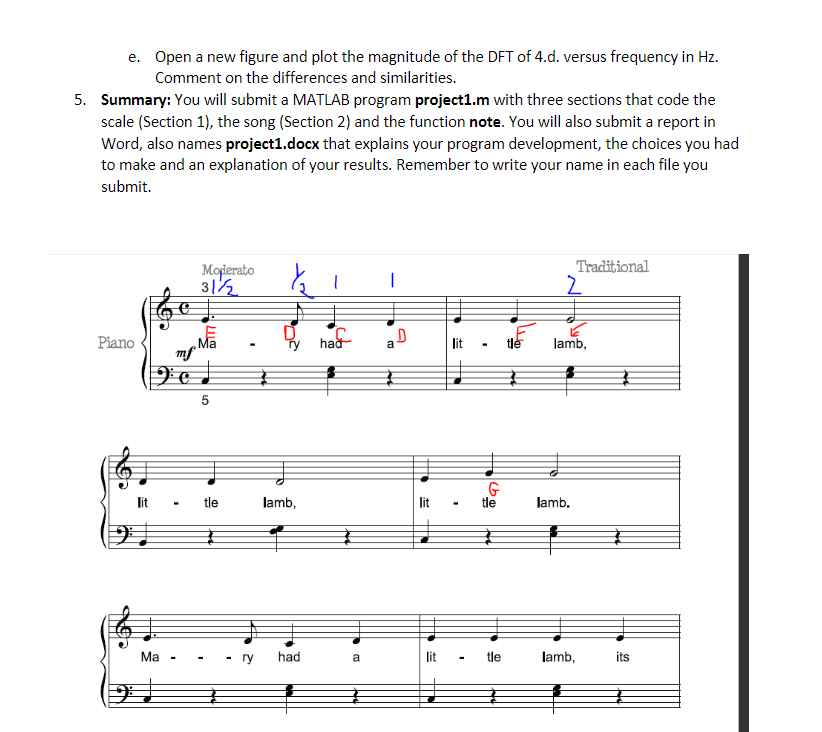
Tutorial on musical frequencies: An octave consists of 12 notes between C and the next C. On the piano, the middle C has a central frequency of fo=261.6 Hz. Next C, C", has twice the frequency, or 523.2Hz. There are 12 notes between them: [CCD D'EFPG GA ABC]. C is read C sharp. Let's denote the frequencies of these notes as [fo fa fa fa faz]. Each frequency is given by f= f, 2622 which satisfies f.2= 2fo, the frequency of the c. 0000000000 GRAND STAFF 0000000 PIANO KEYS Consider the upper staff of the music score Mary Had a Little Lamb below. It is written in 4/4 time which means that duration of the notes in each measure must add up to 4. Measures are separated by a solid vertical line. The notes and their duration are given in the table below. EDCDIE EE DDDEGGIE DCDIE EEE 1.5 5 1 1 1 1 2 1 1 2 1 1 2 1.5 5 1 1 1 1 1 1 D DEDIC 1 1 114 You should do the following tasks: 1. Start a MATLAB main program and save it under the name of "project1.m". Design it so it runs in sections. 2. Write a MATLAB function that outputs a vector corresponding to one of the musical notes with a prescribed duration. The input to the function should be one of the 12 notes in letter form (A through G, including sharps) and duration in seconds. The output should be the vector of samples. The name of the function should be "note" and it should be the last section of "project1.m". 3. Section 1 of the main program should a. Call the function note for each one of the 12 notes (C, C#, D, D#, E, F, F#, G, G#, A, A#, B (C)] comprising the scale for a duration of d=0.2 seconds. How many samples is 0.2 seconds of any one of these signals? b. Collate the output vectors in a large vector called scale so that scale = [X1 X2 X3 ..x12] (side by side) where xi is the ith vector output of the function note. C. Use the MATLAB instruction soundsc to play the vector scale. d. Use a 12-row, 3-column subplot to plot the first 20 ms each of the 12 notes vs time in the first column. Use proper labels and titles. Reserve the other columns for later. e. Plot the vector scale versus time. f. Compute the 4096-point DFT of each note in the score. g. Use columns 2 and 3 of the subplot of 3.d to plot the magnitude and the log magnitude of the DFT computed above versus frequency in Hz. h. Function note should i. Accept input information as a character string (C or C# or D etc) indicating the note and a number, d, indicating the duration of the note in seconds. For this exercise, choose d=0.25 seconds for all the notes. ii. Generate samples of a sine function at the frequency of the note. Each note's frequency should be calculated in the function using the formula that the kth note's frequency is f*= 261.6 x 25/12 Hz. as described in the Tutorial above. iii. The sample frequency fs = 1500 Hz. should be the same for all the notes. You can choose this number to be a constant in the main program or in the function note. Is F. larger than the BW of the signals? iv. The output of the function note should be the samples of the sinusoid in a vector x. V. Change the sampling rate fs = 800 Hz and run the program again. Comment on changes in time and frequency plots and sounds. Explain. 4. Section 2 of "Project1.m," should be a program to a. Call the function note for each note and duration of the musical score Mary Has a Little Lamb. b. Collate the vector outputs in a large vector called song so that song=[x1 X2 X3..] where xi is the ish vector output of the function note. C. Use the MATLAB instruction soundsc to play the vector song. d. Compute the N-point DFT of the notes E of measures 1, 1.5 and 2. You will see that they appear in the first row of the score. N should be the same for each note and should be 10 times the number of samples in the longest note. e. Open a new figure and plot the magnitude of the DFT of 4.d. versus frequency in Hz. Comment on the differences and similarities. 5. Summary: You will submit a MATLAB program project1.m with three sections that code the scale (Section 1), the song (Section 2) and the function note. You will also submit a report in Word, also names project1.docx that explains your program development, the choices you had to make and an explanation of your results. Remember to write your name in each file you submit. Traditional Moderato 31/2 1 2 Piano DITT had AD - a lit tle lamb, mf Dic 5 lit - tle lamb, lit - G tle lamb. Ma - ry had a lit - tle lamb, its
Step by Step Solution
There are 3 Steps involved in it

Get step-by-step solutions from verified subject matter experts