

Question: Plot graph using graph paper (millimetric paper) and Excel. The Editor's Report in the November 2003 issue of Technometrics provides the following information regarding the
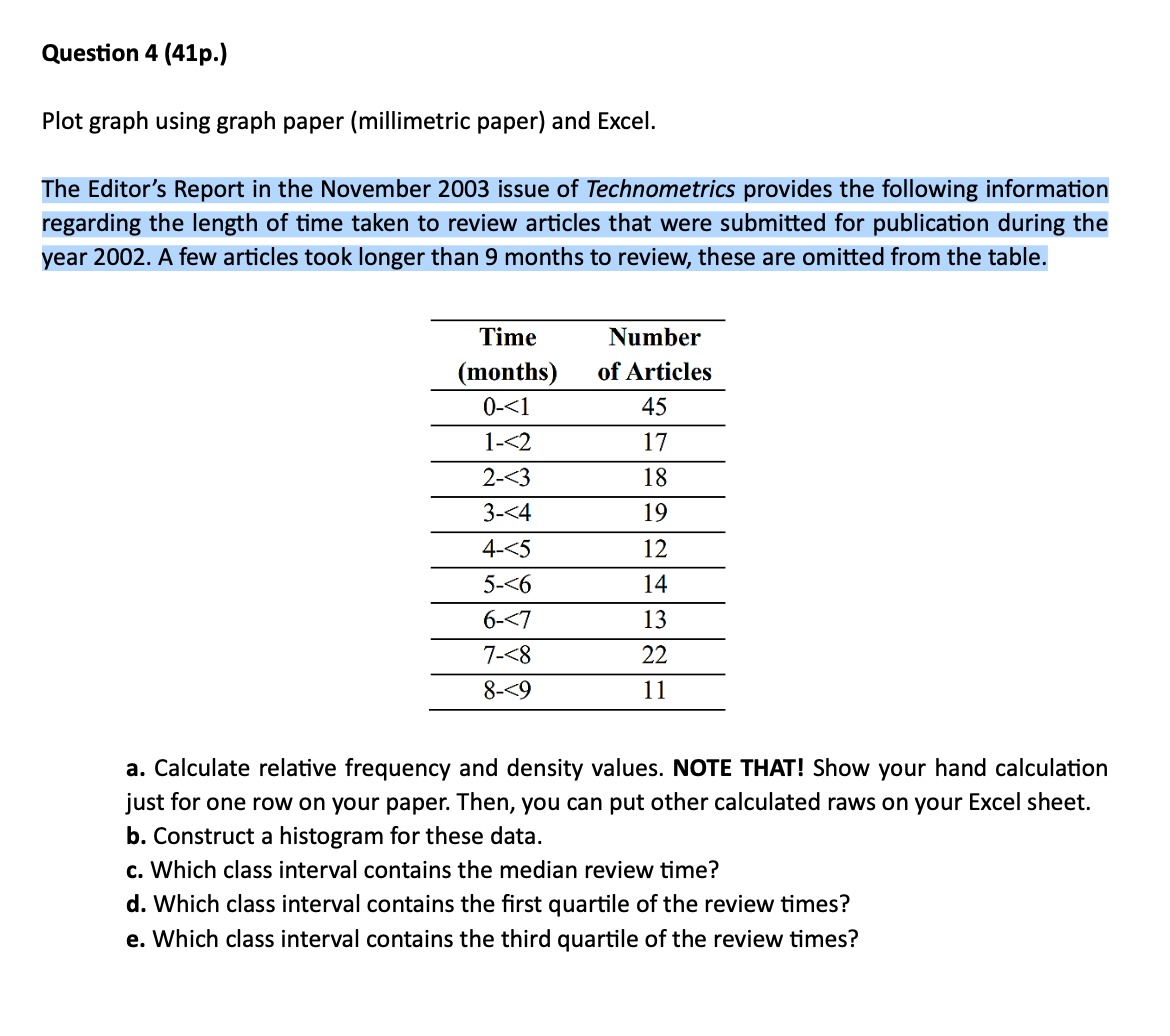
Plot graph using graph paper (millimetric paper) and Excel. The Editor's Report in the November 2003 issue of Technometrics provides the following information regarding the length of time taken to review articles that were submitted for publication during the year 2002. A few articles took longer than 9 months to review, these are omitted from the table. a. Calculate relative frequency and density values. NOTE THAT! Show your hand calculation just for one row on your paper. Then, you can put other calculated raws on your Excel sheet. b. Construct a histogram for these data. c. Which class interval contains the median review time? d. Which class interval contains the first quartile of the review times? e. Which class interval contains the third quartile of the review times
Step by Step Solution
There are 3 Steps involved in it

Get step-by-step solutions from verified subject matter experts