

Question: plot should look lofe this: 6-D) Using MATLAB, plot the single degree-of-freedom frequency response function (both magnitude/phase and real/imaginary format), mo+joc+k Use the nominal values;
plot should look lofe this:
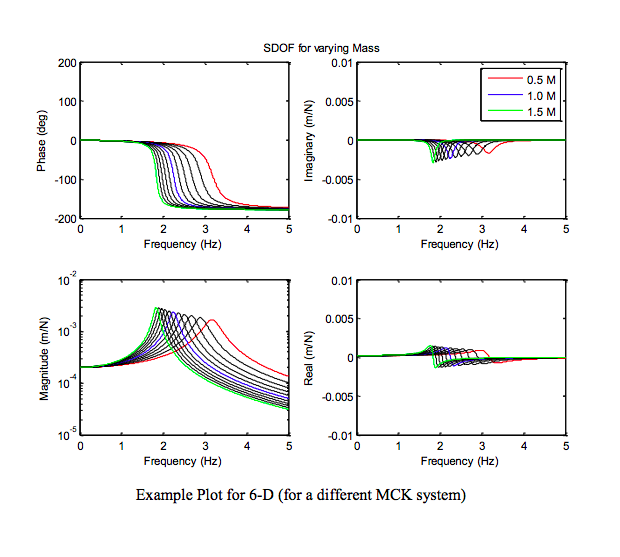
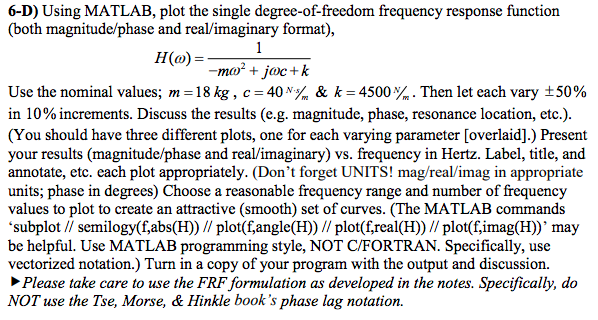
6-D) Using MATLAB, plot the single degree-of-freedom frequency response function (both magnitude/phase and real/imaginary format), mo+joc+k Use the nominal values; m-18 k , C-40 N% & k-4500 % . Then let each vary 50% in 10% increments. Discuss the results (e.g. magnitude, phase, resonance location, etc.). (You should have three different plots, one for each varying parameter [overlaid].) Present your results (magnitude/phase and real/imaginary) vs. frequency in Hertz. Label, title, and annotate, etc. each plot appropriately. (Don't forget UNITS! mag/real/imag in appropriate units; phase in degrees) Choose a reasonable frequency range and number of frequency values to plot to create an attractive (smooth) set of curves. (The MATLAB commands 'subplot // semilogy(f,abs(H)) // plot(f,angle(H)) // plot(f,real(H) // plot(f,imag(H))' may be helpful. Use MATLAB programming style, NOT C/FORTRAN. Specifically, us
Step by Step Solution
There are 3 Steps involved in it

Get step-by-step solutions from verified subject matter experts