

Question: Plot (that is, as a function of time n). Upload a picture of your graph. 4. Predator-Prey Population Model In the wild, the population
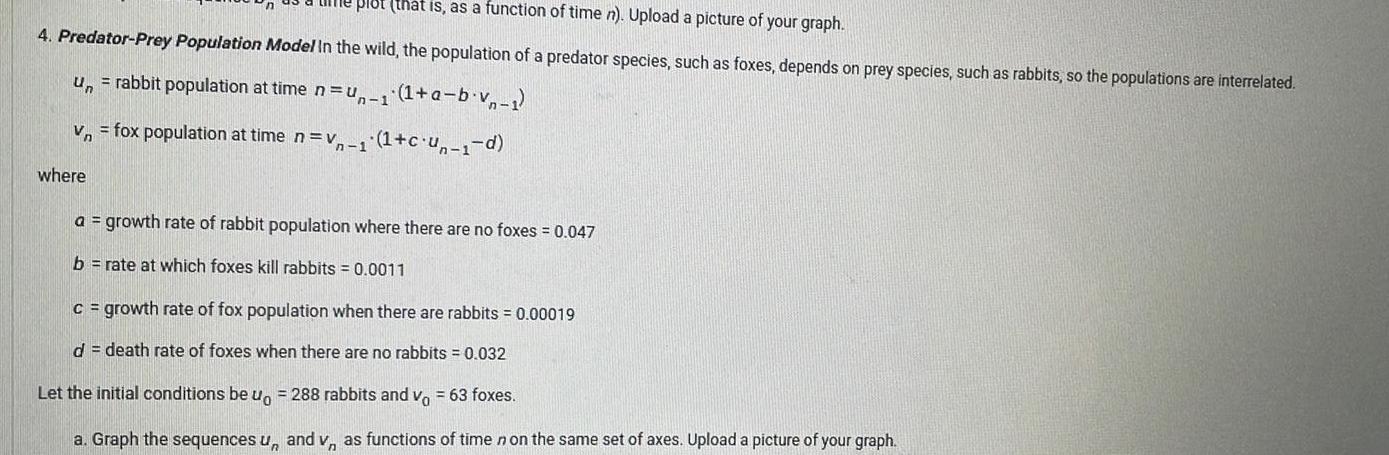
Plot (that is, as a function of time n). Upload a picture of your graph. 4. Predator-Prey Population Model In the wild, the population of a predator species, such as foxes, depends on prey species, such as rabbits, so the populations are interrelated. u, = rabbit population at time n=un-1 (1+a-b.vn-1) V fox population at time nv-1(1+c-u-1-d) where a = growth rate of rabbit population where there are no foxes = 0.047 b = rate at which foxes kill rabbits = 0.0011 c = growth rate of fox population when there are rabbits = 0.00019 d = death rate of foxes when there are no rabbits = 0.032 Let the initial conditions be uo = 288 rabbits and vo = 63 foxes. a. Graph the sequences u, and v, as functions of time n on the same set of axes. Upload a picture of your graph.
Step by Step Solution
There are 3 Steps involved in it

Get step-by-step solutions from verified subject matter experts