

Question: Plot the actual demand, the simple exponential smoothing (SES) forecast, and trend-adjusted exponential smoothing (FIT) forecast on the same graph. Briefly comment on the observed
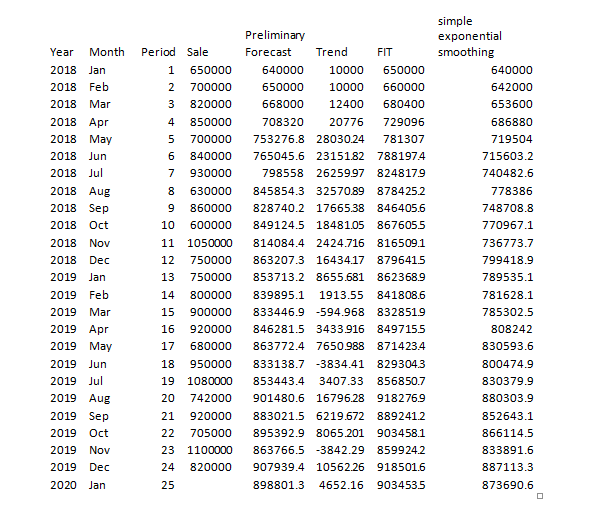
Plot the actual demand, the simple exponential smoothing (SES) forecast, and trend-adjusted exponential smoothing (FIT) forecast on the same graph. Briefly comment on the observed difference(s) between the plots of the two forecasts.
Period Sale 1 650000 2 700000 3 820000 4 850000 5 700000 6 840000 7 930000 8 9 630000 860000 600000 10 Year Month 2018 Jan 2018 Feb 2018 Mar 2018 Apr 2018 May 2018 Jun 2018 Jul 2018 Aug 2018 Sep 2018 Oct 2018 Nov 2018 Dec 2019 Jan 2019 Feb 2019 Mar 2019 Apr 2019 May 2019 Jun 2019 Jul 2019 Aug 2019 Sep 2019 Oct 2019 Nov 2019 Dec 11 12 13 Preliminary Forecast Trend FIT 640000 10000 650000 650000 10000 660000 668000 12400 680400 708320 20776 729096 753276.8 28030.24 781307 765045.6 23151.82 7881974 798558 26259.97 824817.9 845854.3 32570.89 878425.2 828740.2 17665.38 846405.6 849124.5 18481.05 8676055 814084.4 2424.716 816509.1 863207.3 16434.17 8796415 853713.2 8655.681 862368.9 839895.1 1913.55 841808.6 833446.9 -594.968 832851.9 846281.5 3433.916 8497155 863772.4 7650.988 871423.4 833138.7 3834.41 8293043 853443.4 3407.33 856850.7 901480.6 16796.28 9182769 883021.5 6219.672 889241.2 895392.9 8065.201 903458.1 863766.5 -3842.29 859924.2 907939.4 10562.26 918501.6 898801.3 4652.16 903453.5 1050000 750000 750000 800000 900000 920000 680000 950000 1080000 742000 920000 705000 1100000 820000 simple exponential smoothing 640000 642000 653600 686880 719504 715603.2 740482.6 778386 748708.8 770967.1 736773.7 799418.9 789535.1 781628.1 785302.5 808242 830593.6 800474.9 830379.9 880303.9 852643.1 866114.5 833891.6 887113.3 14 15 16 17 18 19 20 21 22 23 24 2020 Jan 25 873690.6
Step by Step Solution
There are 3 Steps involved in it
1 Expert Approved Answer
Step: 1 Unlock

Question Has Been Solved by an Expert!
Get step-by-step solutions from verified subject matter experts
Step: 2 Unlock
Step: 3 Unlock