

Question: Plot the data in a way that is appropriate for inclusion in a textbook (i.e. with axes, labels, title, etc.). Consider several di?erent types of
Plot the data in a way that is appropriate for inclusion in a textbook (i.e. with axes, labels, title, etc.). Consider several di?erent types of models (power, exponential, linear, quadratic, cubic, etc.) would be appropriate for the velocity based on the data. Your goal is to predict v(t), where v is velocity in ft/s and t is time in seconds.
Using the velocity model you just created, determine the maximum and minimum values of the acceleration over the interval [0,140].
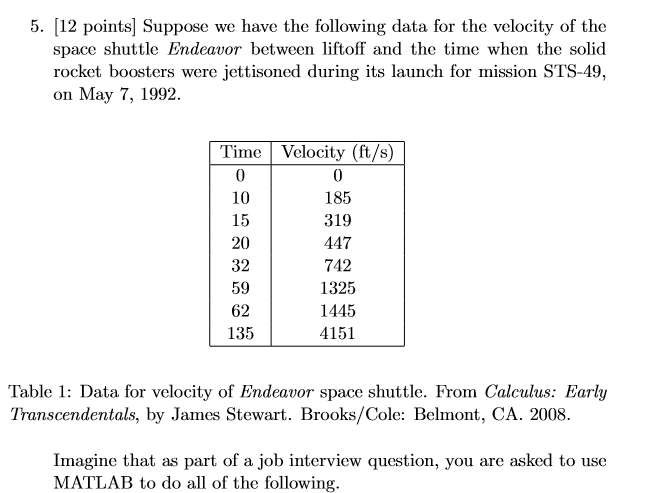
5. [12 points] Suppose we have the following data for the velocity of the space shuttle Endeavor between liftoff and the time when the solid rocket boosters were jettisoned during its launch for mission STS-49, on May 7, 1992 Time|Velocity (ft/s) 10 15 20 32 59 62 135 0 185 319 447 742 1325 1445 4151 Table 1: Data for velocity of Endeavor space shuttle. From Calculus: Early Transcendentals, by James Stewart. Brooks/Cole: Belmont, CA. 2008 Imagine that as part of a job interview question, you are asked to use MATLAB to do all of the following
Step by Step Solution
There are 3 Steps involved in it

Get step-by-step solutions from verified subject matter experts