

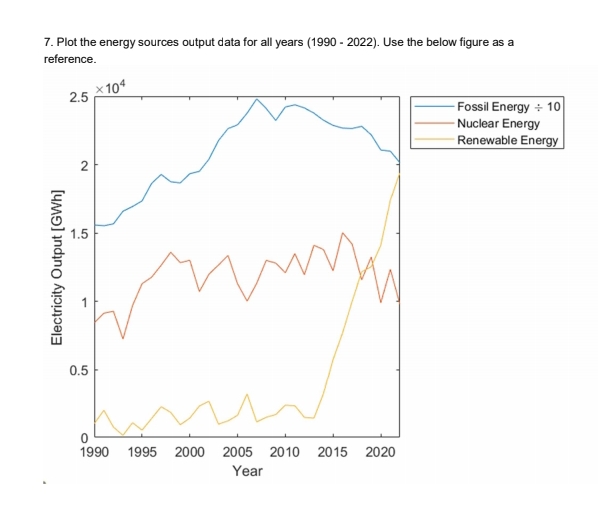
Question: Plot the energy sources output data for all years ( 1 9 9 0 - 2 0 2 2 ) . Use the below figure
Plot the energy sources output data for all years Use the below figure as a reference.
Step by Step Solution
There are 3 Steps involved in it
1 Expert Approved Answer
Step: 1 Unlock

Question Has Been Solved by an Expert!
Get step-by-step solutions from verified subject matter experts
Step: 2 Unlock
Step: 3 Unlock