

Question: Plot the final forecast along with the actual sales data. Does the forecast appear reasonable? Explain. Why do you think the April, May, August, and
Plot the final forecast along with the actual sales data. Does the forecast appear reasonable? Explain.
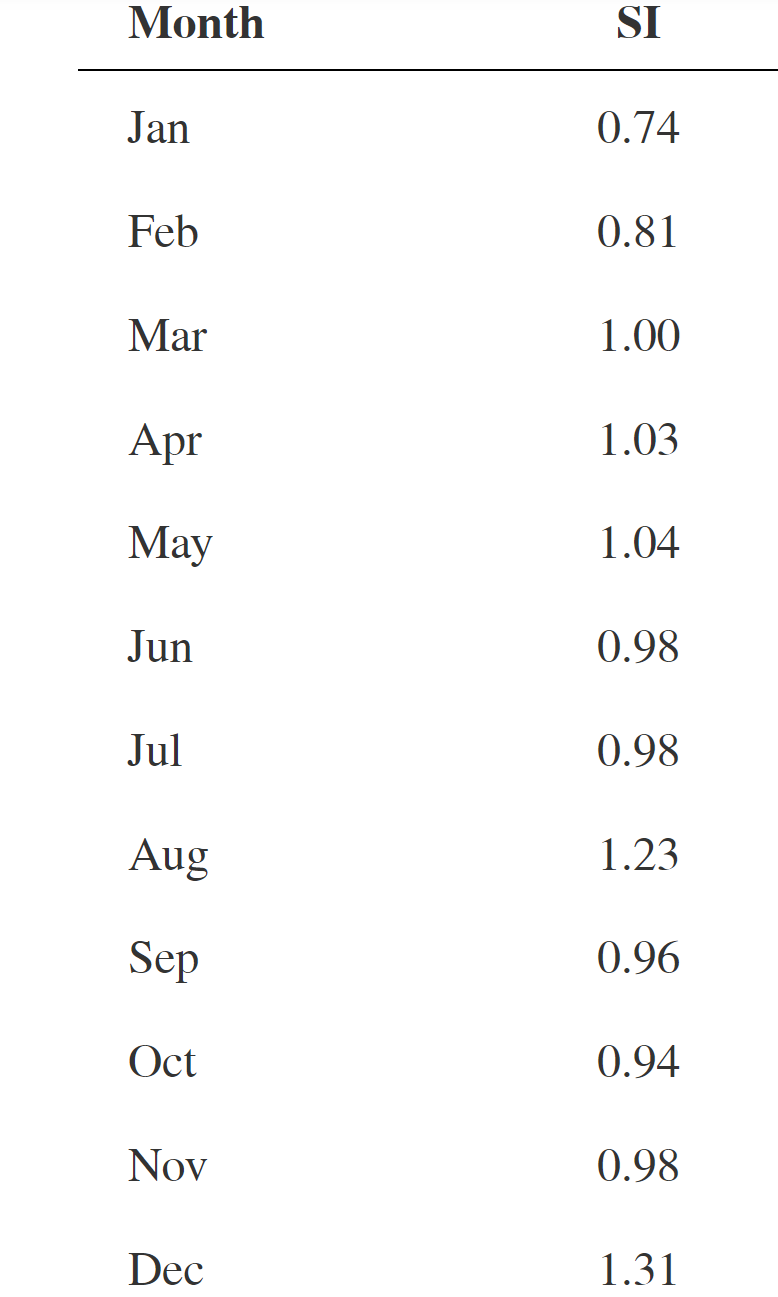 Why do you think the April, May, August, and December seasonal indices are greater than 1?
\begin{tabular}{lc} Month & SI \\ \hline Jan & 0.74 \\ Feb & 0.81 \\ Mar & 1.00 \\ Apr & 1.03 \\ May & 1.04 \\ Jun & 0.98 \\ Jul & 0.98 \\ Aug & 1.23 \\ Sep & 0.96 \\ Oct & 0.94 \\ Nov & 0.98 \\ Dec & 1.31 \end{tabular}
Step by Step Solution
There are 3 Steps involved in it
1 Expert Approved Answer
Step: 1 Unlock

Question Has Been Solved by an Expert!
Get step-by-step solutions from verified subject matter experts
Step: 2 Unlock
Step: 3 Unlock