

Question: Plot the following 2D and 3D graphs using plot, plot3 and surf or mesh, as appropriate. Use subplot to place multiple graphs in a
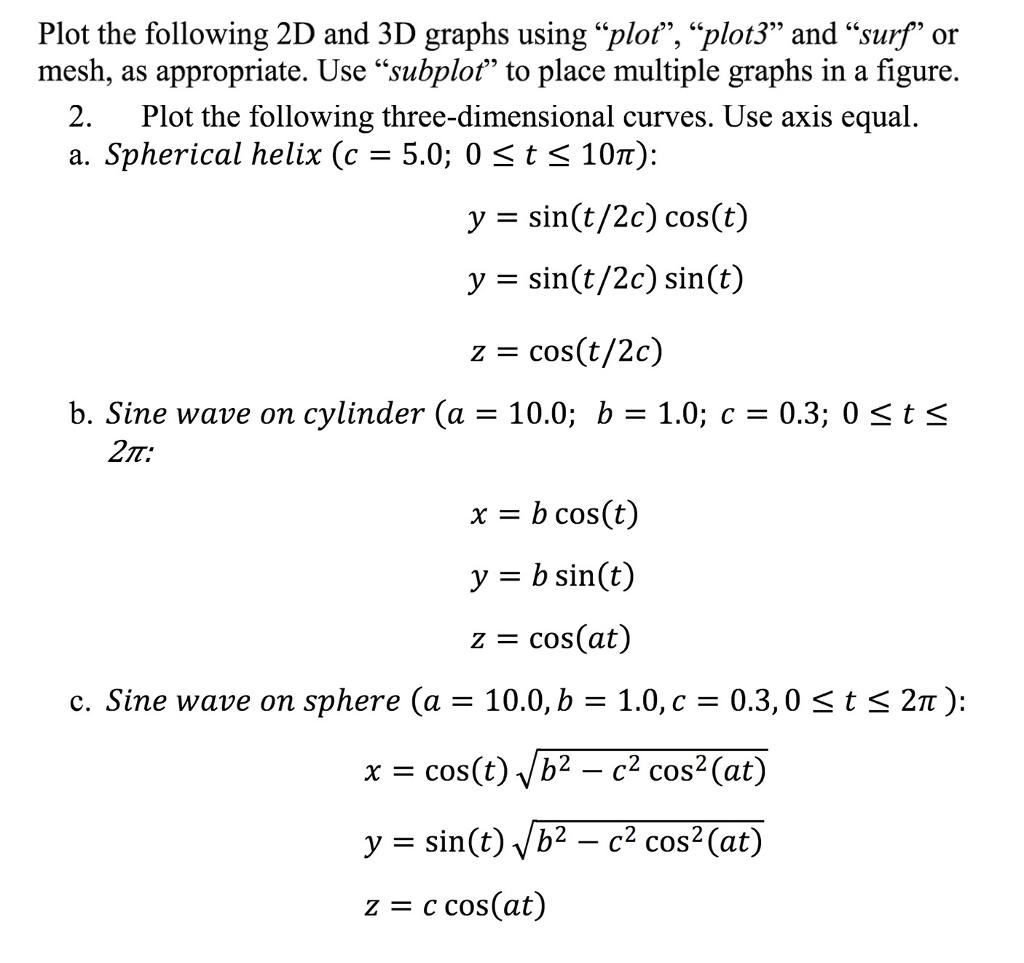
Plot the following 2D and 3D graphs using "plot", "plot3" and "surf" or mesh, as appropriate. Use "subplot" to place multiple graphs in a figure. 2. Plot the following three-dimensional curves. Use axis equal. a. Spherical helix (c = 5.0; 0 t 10): y = sin(t/2c) cos(t) y = sin(t/2c) sin(t) Z = cos(t/2c) b. Sine wave on cylinder (a = 10.0; b = 1.0; c = 0.3; 0 t 2: X = b cos(t) y = b sin(t) z = cos(at) c. Sine wave on sphere (a = 10.0, b = 1.0, c = 0.3, 0 t 2): X = cos(t)bc cos (at) y = sin(t)b - c cos (at) z = c cos(at)
Step by Step Solution
3.45 Rating (165 Votes )
There are 3 Steps involved in it

Get step-by-step solutions from verified subject matter experts