

Question: Use matlab 1. Multiple functions on the same graph: a. Define t using a sequenced vector over the interval [0, 2] with a step size
Use matlab
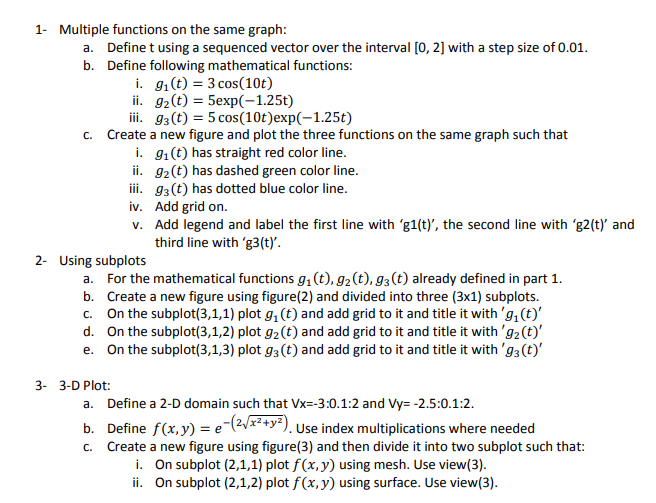
1. Multiple functions on the same graph: a. Define t using a sequenced vector over the interval [0, 2] with a step size of 0.01. b. Define following mathematical functions: i. gi(t) = 3 cos(10t) ii. 92(t) = 5exp(-1.25t) iii. 93(t) = 5 cos(10t)exp(-1.25t) C. Create a new figure and plot the three functions on the same graph such that i. 91(t) has straight red color line. ii. 92(t) has dashed green color line. iii. 93(t) has dotted blue color line. iv. Add grid on. V. Add legend and label the first line with 'g1(t)', the second line with 'g2(t) and third line with 'g3(t)'. 2- Using subplots a. For the mathematical functions gi(t),gz(t), g3(t) already defined in part 1. b. Create a new figure using figure(2) and divided into three (3x1) subplots. C. On the subplot(3,1,1) plot g(t) and add grid to it and title it with 'g.(t)' d. On the subplot(3,1,2) plot g2(t) and add grid to it and title it with 'gz(t)' e. On the subplot(3,1,3) plot g(t) and add grid to it and title it with '93(t)' 3- 3-D Plot: a. Define a 2-D domain such that Vx=-3:0.1:2 and Vy= -2.5.0.1:2. b. Define f(x,y) = e( ****). Use index multiplications where needed C. Create a new figure using figure(3) and then divide it into two subplot such that: i. On subplot (2,1,1) plot f(x,y) using mesh. Use view(3). ii. On subplot (2,1,2) plot f(x,y) using surface. Use view(3)
Step by Step Solution
There are 3 Steps involved in it

Get step-by-step solutions from verified subject matter experts