

Question: Plot the following points using desmos graphing calculator and then show the result of tranforming them usung the polynonial kernel using r=1/2 and d=2,
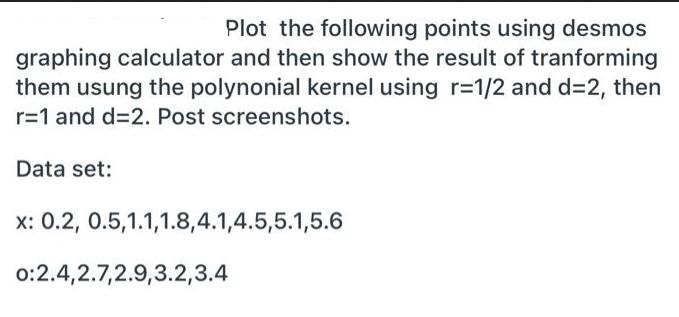
Plot the following points using desmos graphing calculator and then show the result of tranforming them usung the polynonial kernel using r=1/2 and d=2, then r=1 and d=2. Post screenshots. Data set: x: 0.2, 0.5,1.1,1.8,4.1,4.5,5.1,5.6 0:2.4,2.7,2.9,3.2,3.4
Step by Step Solution
There are 3 Steps involved in it
1 Expert Approved Answer
Step: 1 Unlock

Question Has Been Solved by an Expert!
Get step-by-step solutions from verified subject matter experts
Step: 2 Unlock
Step: 3 Unlock