

Question: Plot the following risky portfolios on a graph: a ) Which of these portfolios are efficient? Which portfolios are inefficient? b ) Suppose you can
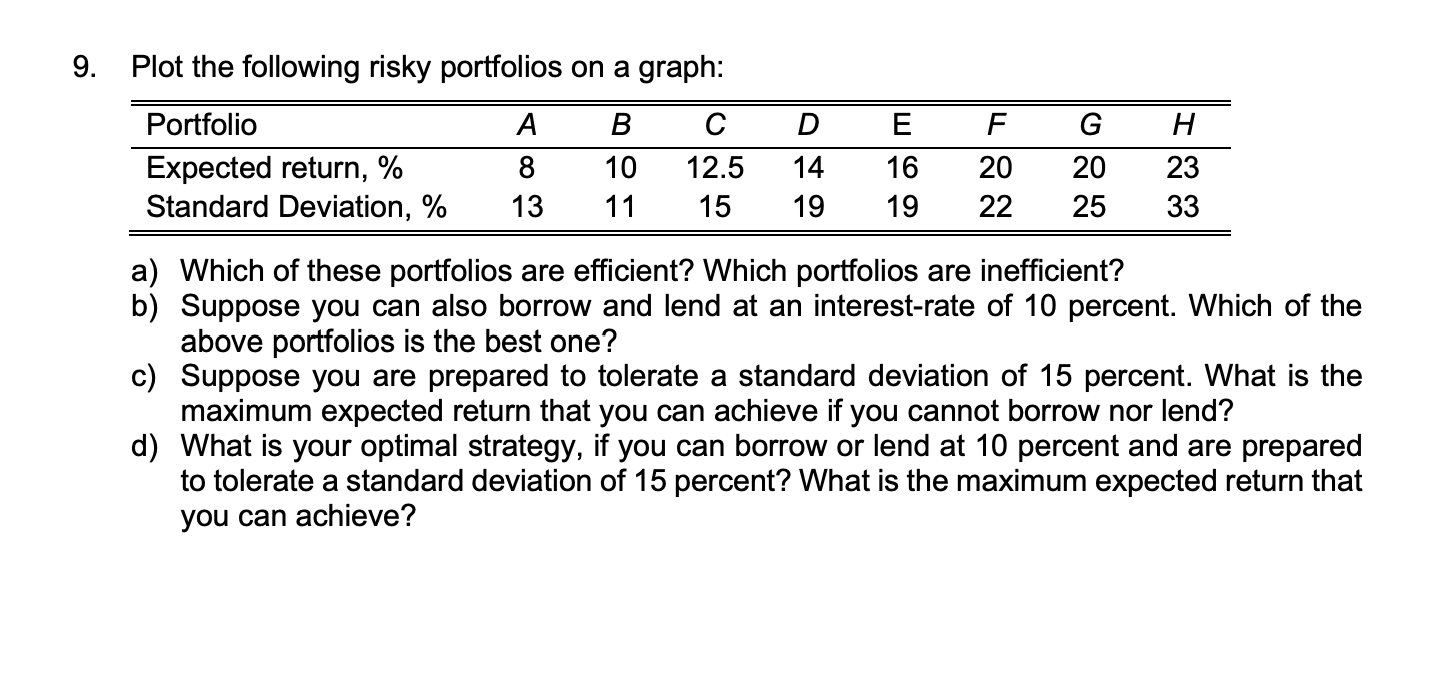
Plot the following risky portfolios on a graph:
a Which of these portfolios are efficient? Which portfolios are inefficient?
b Suppose you can also borrow and lend at an interestrate of percent. Which of the above portfolios is the best one?
c Suppose you are prepared to tolerate a standard deviation of percent. What is the maximum expected return that you can achieve if you cannot borrow nor lend?
d What is your optimal strategy, if you can borrow or lend at percent and are prepared to tolerate a standard deviation of percent? What is the maximum expected return that you can achieve?
Step by Step Solution
There are 3 Steps involved in it
1 Expert Approved Answer
Step: 1 Unlock

Question Has Been Solved by an Expert!
Get step-by-step solutions from verified subject matter experts
Step: 2 Unlock
Step: 3 Unlock