

Question: Plot the frequency response for questions a, b, d in the same plot and explain the observation. a) Implement a passive RC low pass filter
Plot the frequency response for questions a, b, d in the same plot and explain the observation.
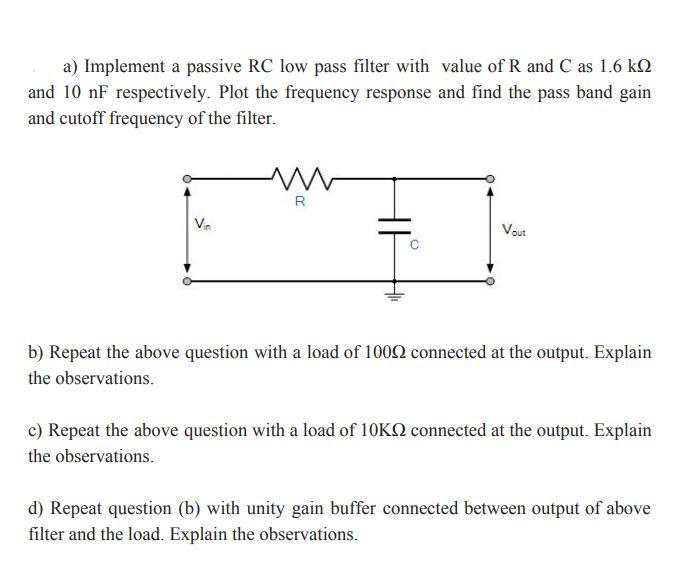
a) Implement a passive RC low pass filter with value of R and C as 1.6 k2 and 10 nF respectively. Plot the frequency response and find the pass band gain and cutoff frequency of the filter. R Vin Vout b) Repeat the above question with a load of 1002 connected at the output. Explain the observations. c) Repeat the above question with a load of 10KQ connected at the output. Explain the observations. d) Repeat question (b) with unity gain buffer connected between output of above filter and the load. Explain the observations.
Step by Step Solution
3.48 Rating (155 Votes )
There are 3 Steps involved in it
Given circuit is low pass filter We can find out the tr... View full answer

Get step-by-step solutions from verified subject matter experts