

Question: Plot the function y = arctan x in Matlab. Use the command atan, and apply the following specifications: The meshwidth should be h = 0.0001.
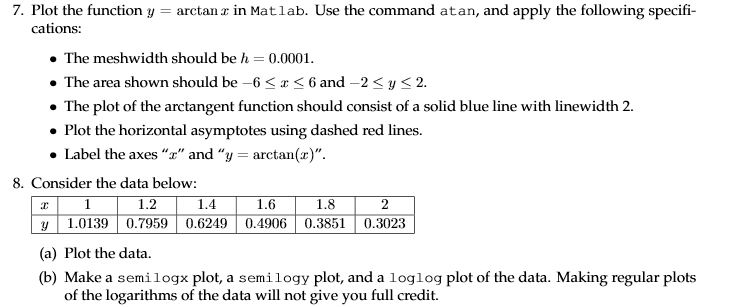
Plot the function y = arctan x in Matlab. Use the command atan, and apply the following specifications: The meshwidth should be h = 0.0001. The area shown should be -6 lessthanorequalto x lessthanorequalto 6 and -2 lessthanorequalto y lessthanorequalto 2. The plot of the arctangent function should consist of a solid blue line with linewidth 2. Plot the horizontal asymptotes using dashed red lines. Label the axes "x" and "y = arctan(x)". Consider the data below: (a) Plot the data. (b) Make a semilogx plot, a semilogy plot, and a loglog plot of the data. Making regular plots of the logarithms of the data will not give you full credit
Step by Step Solution
There are 3 Steps involved in it

Get step-by-step solutions from verified subject matter experts