

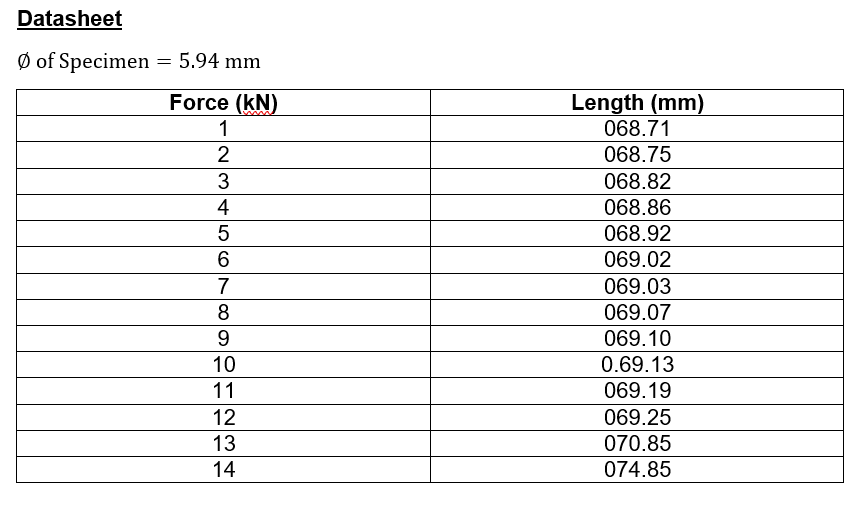
Question: Plot the load vs . elongation on a graph and identify the elastic limit , upper yield using the data from the table attached. point,
Plot the load vs elongation on a graph and identify the elastic limit upper yield using the data from the table attached.
point, lower yield point.
Step by Step Solution
There are 3 Steps involved in it
1 Expert Approved Answer
Step: 1 Unlock

Question Has Been Solved by an Expert!
Get step-by-step solutions from verified subject matter experts
Step: 2 Unlock
Step: 3 Unlock