

Question: Plot the marginal tax rates (measured on the y axis) against the pretax income can you please show step by step how to create this
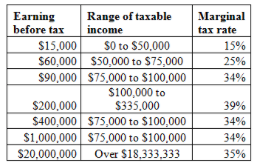
Plot the marginal tax rates (measured on the y axis) against the pretax income
can you please show step by step how to create this graph?? thank you! levels (measured on the x axis). Explain the relationship between these variables.
Marginal tax rate 15% 25% 34% Earning Range of taxable before tax income $15.000 $0 to $50.000 $60,000 $50,000 to $75,000 $90,000 $75,000 to $100,000 $100,000 to $200.000 $335.000 $400,000 $75,000 to $100.000 $1,000,000 $75,000 to $100,000 $20,000,000 Over $18,333,333 39% 34% 34% 35%
Step by Step Solution
There are 3 Steps involved in it
1 Expert Approved Answer
Step: 1 Unlock

Question Has Been Solved by an Expert!
Get step-by-step solutions from verified subject matter experts
Step: 2 Unlock
Step: 3 Unlock