

Question: Plot the minimum variance frontier that you have constructed in the expected return (y-axis) - volatility space (x-axis). Label the GMV and the MVE portfolios
Plot the minimum variance frontier that you have constructed in the expected return (y-axis) - volatility space (x-axis). Label the GMV and the MVE portfolios on the frontier and all the axes correctly. Submit your plot in a separate file. You do not need to include your spreadsheet. All you need to submit is the plot.
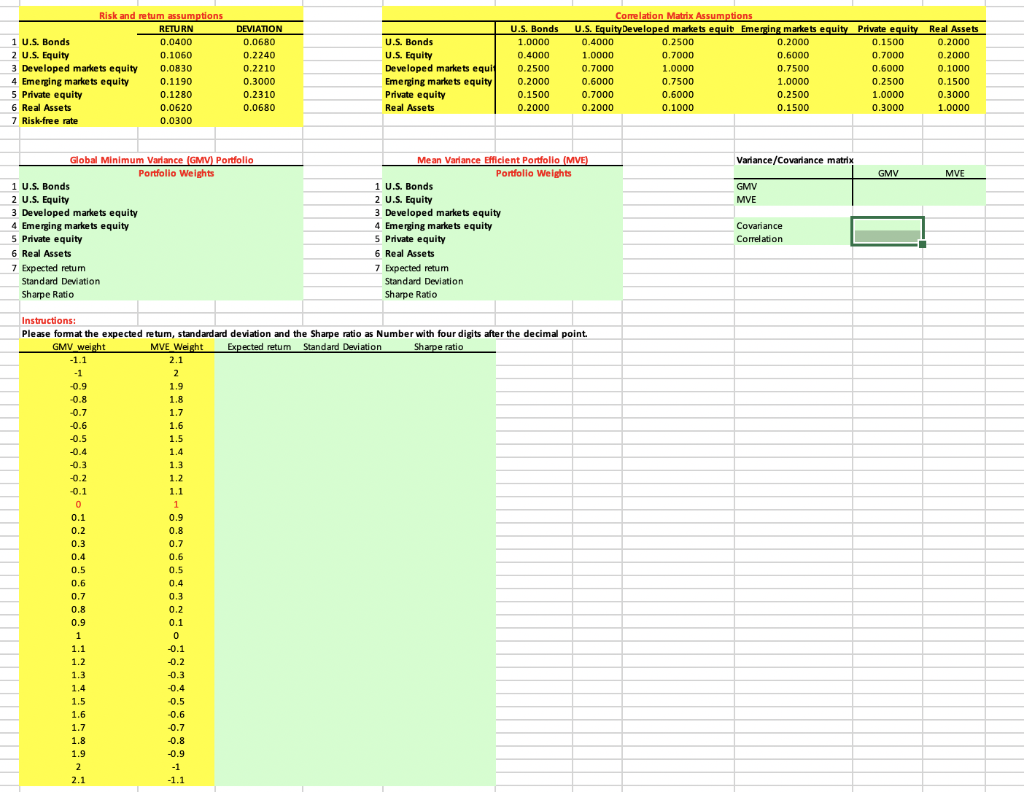
Risk and retum assumptions RETURN 1 U.S. Bonds 0.0400 2 U.S. Equity 0.1060 3 Developed markets equity 0.0830 4 Emerging markets equity 0.1190 5 Private equity 0.1280 6 Real Assets 0.0620 7 Risk-free rate 0.0300 DEVIATION 0.0680 0.2240 0.2210 0.3000 0.2310 0.0680 | U.S. Bonds U.S. Equity Developed markets equit Emerging markets equity | Private equity Real Assets U.S. Bonds 1.0000 0.4000 0.2500 0.2000 0.1500 0.2000 Correlation Matrix Assumptions U.S. Equity Developed markets equit Emerging markets equity Private equity 0.4000 0.2500 0.2000 0.1500 1.0000 0.7000 0.6000 0.7000 0.7000 1.0000 0.7500 0.6000 0.6000 0.7500 1.0000 0.2500 0.7000 0.6000 0.2500 1.0000 0.2000 0.1000 0.1500 0.3000 Real Assets 0.2000 0.2000 0.1000 0.1500 0.3000 1.0000 Variance/Covariance matrix GMV MVE GMV MVE Global Minimum Variance (GMV) Portfolio Portfolio Weights 1 U.S. Bonds 2 U.S. Equity 3 Developed markets equity 4 Emerging markets equity 5 Private equity 6 Real Assets 7 Expected retum Standard Deviation Sharpe Ratio Mean Variance Efficient Portfolio (MVE) Portfolio Weights 1 U.S. Bonds 2 U.S. Equity 3 Developed markets equity 4 Emerging markets equity 5 Private equity 6 Real Assets 7 Expected retum Standard Deviation Sharpe Ratio Covariance Correlation Instructions: Please format the expected retum, standardard deviation and the Sharpe ratio as Number with four digits after the decimal point. GMV weight MVE Weight Expected retum Standard Deviation Sharpe ratio 1.7 1.8 -0.8 1.9 -0,9 EN -1.1 Risk and retum assumptions RETURN 1 U.S. Bonds 0.0400 2 U.S. Equity 0.1060 3 Developed markets equity 0.0830 4 Emerging markets equity 0.1190 5 Private equity 0.1280 6 Real Assets 0.0620 7 Risk-free rate 0.0300 DEVIATION 0.0680 0.2240 0.2210 0.3000 0.2310 0.0680 | U.S. Bonds U.S. Equity Developed markets equit Emerging markets equity | Private equity Real Assets U.S. Bonds 1.0000 0.4000 0.2500 0.2000 0.1500 0.2000 Correlation Matrix Assumptions U.S. Equity Developed markets equit Emerging markets equity Private equity 0.4000 0.2500 0.2000 0.1500 1.0000 0.7000 0.6000 0.7000 0.7000 1.0000 0.7500 0.6000 0.6000 0.7500 1.0000 0.2500 0.7000 0.6000 0.2500 1.0000 0.2000 0.1000 0.1500 0.3000 Real Assets 0.2000 0.2000 0.1000 0.1500 0.3000 1.0000 Variance/Covariance matrix GMV MVE GMV MVE Global Minimum Variance (GMV) Portfolio Portfolio Weights 1 U.S. Bonds 2 U.S. Equity 3 Developed markets equity 4 Emerging markets equity 5 Private equity 6 Real Assets 7 Expected retum Standard Deviation Sharpe Ratio Mean Variance Efficient Portfolio (MVE) Portfolio Weights 1 U.S. Bonds 2 U.S. Equity 3 Developed markets equity 4 Emerging markets equity 5 Private equity 6 Real Assets 7 Expected retum Standard Deviation Sharpe Ratio Covariance Correlation Instructions: Please format the expected retum, standardard deviation and the Sharpe ratio as Number with four digits after the decimal point. GMV weight MVE Weight Expected retum Standard Deviation Sharpe ratio 1.7 1.8 -0.8 1.9 -0,9 EN
Step by Step Solution
There are 3 Steps involved in it

Get step-by-step solutions from verified subject matter experts