

Question: Plot the normalized upconversion emission intensity against the normalized neutral density filter transmission to produce a quadratic curve. A log-log plot of this data should
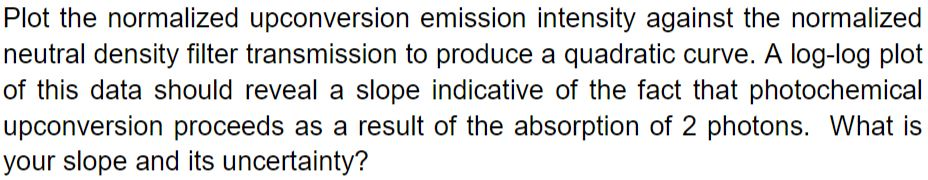
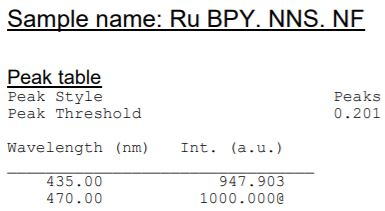
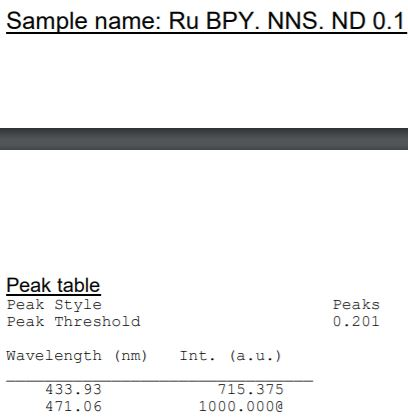
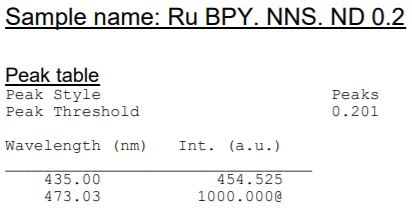
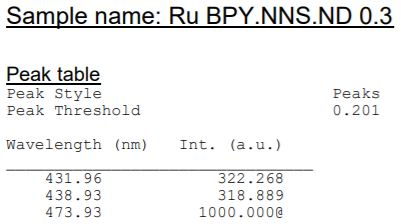
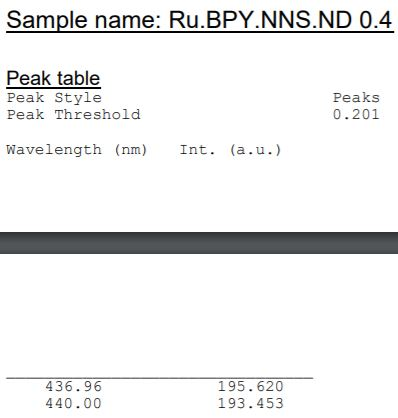
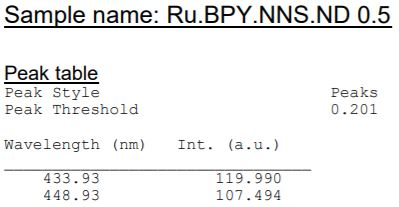
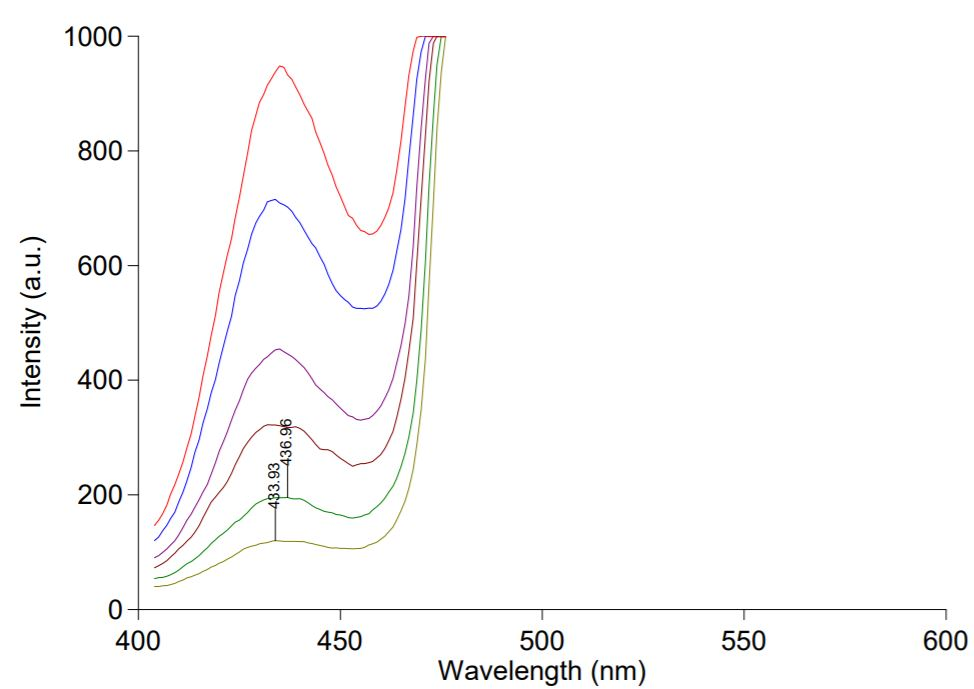
Plot the normalized upconversion emission intensity against the normalized neutral density filter transmission to produce a quadratic curve. A log-log plot of this data should reveal a slope indicative of the fact that photochemical upconversion proceeds as a result of the absorption of 2 photons. What is your slope and its uncertainty? Sample name: Ru BPY. NNS. NF Peak table Peak Style Peak Threshold Peaks 0.201 Wavelength (nm) Int. (a.u.) 435.00 470.00 947.903 1000.000 Sample name: Ru BPY. NNS. ND 0.1 Peak table Peak Style Peak Threshold Peaks 0.201 Wavelength (nm) Int. (a.u.) 433.93 471.06 715.375 1000.000 Sample name: Ru BPY. NNS. ND 0.2 Peak table Peak Style Peak Threshold Peaks 0.201 Wavelength (nm) Int. (a.u.) 435.00 473.03 454.525 1000.000@ Sample name: Ru BPY.NNS.ND 0.3 Peak table Peak Style Peak Threshold Peaks 0.201 Wavelength (nm) Int. (a.u.) 431.96 438.93 473.93 322.268 318.889 1000.000@ Sample name: Ru.BPY.NNS.ND 0.4 Peak table Peak Style Peak Threshold Peaks 0.201 Wavelength (nm) Int. (a.u.) 436.96 440.00 195.620 193.453 Sample name: Ru.BPY.NNS.ND 0.5 Peak table Peak Style Peak Threshold Peaks 0.201 Wavelength (nm) Int. (a.u.) 433.93 448.93 119.990 107.494 1000 800 600 Intensity (a.u.) 400 483.93369 200 0 400 450 550 600 500 Wavelength (nm) Plot the normalized upconversion emission intensity against the normalized neutral density filter transmission to produce a quadratic curve. A log-log plot of this data should reveal a slope indicative of the fact that photochemical upconversion proceeds as a result of the absorption of 2 photons. What is your slope and its uncertainty? Sample name: Ru BPY. NNS. NF Peak table Peak Style Peak Threshold Peaks 0.201 Wavelength (nm) Int. (a.u.) 435.00 470.00 947.903 1000.000 Sample name: Ru BPY. NNS. ND 0.1 Peak table Peak Style Peak Threshold Peaks 0.201 Wavelength (nm) Int. (a.u.) 433.93 471.06 715.375 1000.000 Sample name: Ru BPY. NNS. ND 0.2 Peak table Peak Style Peak Threshold Peaks 0.201 Wavelength (nm) Int. (a.u.) 435.00 473.03 454.525 1000.000@ Sample name: Ru BPY.NNS.ND 0.3 Peak table Peak Style Peak Threshold Peaks 0.201 Wavelength (nm) Int. (a.u.) 431.96 438.93 473.93 322.268 318.889 1000.000@ Sample name: Ru.BPY.NNS.ND 0.4 Peak table Peak Style Peak Threshold Peaks 0.201 Wavelength (nm) Int. (a.u.) 436.96 440.00 195.620 193.453 Sample name: Ru.BPY.NNS.ND 0.5 Peak table Peak Style Peak Threshold Peaks 0.201 Wavelength (nm) Int. (a.u.) 433.93 448.93 119.990 107.494 1000 800 600 Intensity (a.u.) 400 483.93369 200 0 400 450 550 600 500 Wavelength (nm)
Step by Step Solution
There are 3 Steps involved in it

Get step-by-step solutions from verified subject matter experts