

Question: Plot the pressure coefficient C p as a function of the distance along the airfoil for each angle of attack ( you should have 5
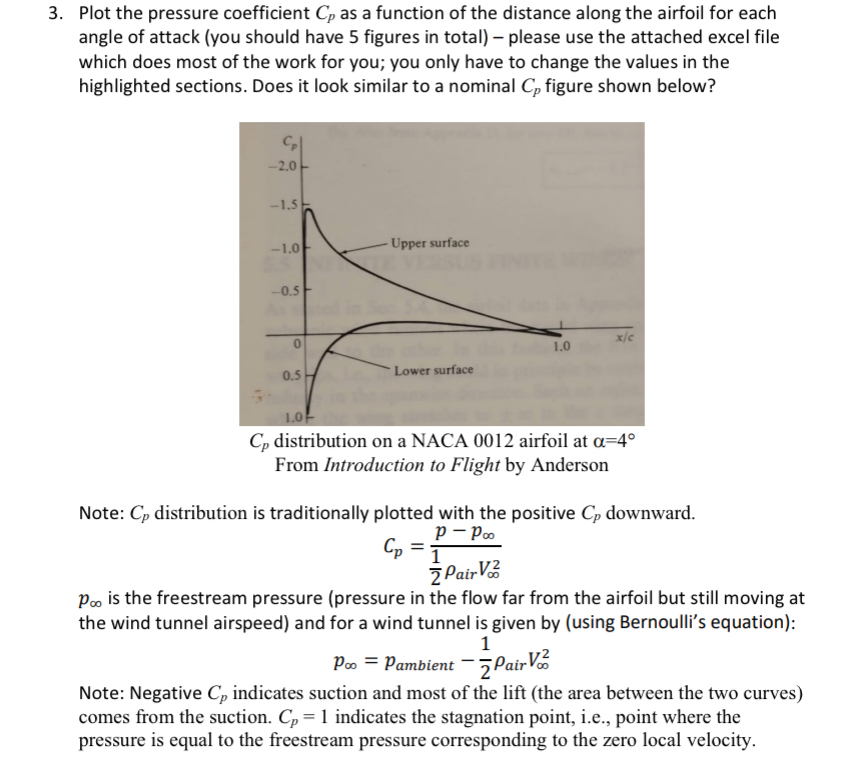
Plot the pressure coefficient as a function of the distance along the airfoil for each angle of attack you should have figures in total please use the attached excel file which does most of the work for you; you only have to change the values in the highlighted sections. Does it look similar to a nominal figure shown below?
From Introduction to Flight by Anderson
Note: distribution is traditionally plotted with the positive downward.
is the freestream pressure pressure in the flow far from the airfoil but still moving at the wind tunnel airspeed and for a wind tunnel is given by using Bernoulli's equation:
Note: Negative indicates suction and most of the lift the area between the two curves comes from the suction. indicates the stagnation point, ie point where the pressure is equal to the freestream pressure corresponding to the zero local velocity.
Step by Step Solution
There are 3 Steps involved in it
1 Expert Approved Answer
Step: 1 Unlock

Question Has Been Solved by an Expert!
Get step-by-step solutions from verified subject matter experts
Step: 2 Unlock
Step: 3 Unlock