

Question: Plot the Quantity demanded and Quantity Supplied on graph. Show the equilibrium price and quantity. In addition, highlight the area of surplus and shortage as
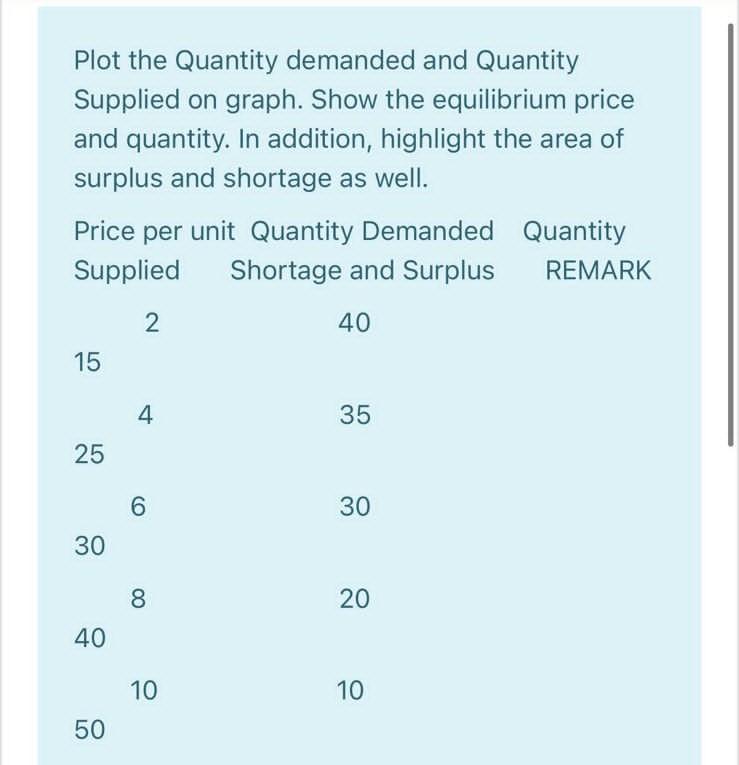
Plot the Quantity demanded and Quantity Supplied on graph. Show the equilibrium price and quantity. In addition, highlight the area of surplus and shortage as well. Price per unit Quantity Demanded Quantity Supplied Shortage and Surplus REMARK 2 40 15 4. 35 25 6 30 30 8 20 40 10 10 50
Step by Step Solution
There are 3 Steps involved in it
1 Expert Approved Answer
Step: 1 Unlock

Question Has Been Solved by an Expert!
Get step-by-step solutions from verified subject matter experts
Step: 2 Unlock
Step: 3 Unlock