

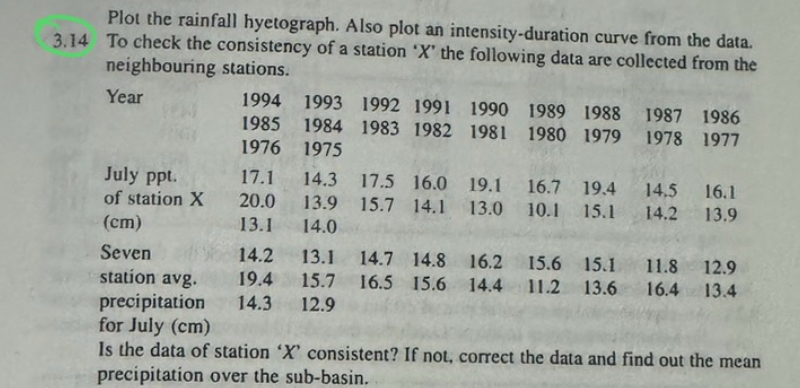
Question: Plot the rainfall hyetograph. Also plot an intensity - duration curve from the data. 3 . 1 4 To check the consistency of a station
Plot the rainfall hyetograph. Also plot an intensityduration curve from the data.
To check the consistency of a station the following data are collected from the neighbouring stations.
tableYear
Step by Step Solution
There are 3 Steps involved in it
1 Expert Approved Answer
Step: 1 Unlock

Question Has Been Solved by an Expert!
Get step-by-step solutions from verified subject matter experts
Step: 2 Unlock
Step: 3 Unlock