

Question: Plot the three stocks, the minimum variance portfolio and the market value-weighted portfolio in a coordinate system with the standard deviation from the first axis
Plot the three stocks, the minimum variance portfolio and the market value-weighted portfolio in a coordinate system with the standard deviation from the first axis and the expected return up the second axis.
Given the following info
Stock A: Expected return 12%. std=0.15
Stock B: Expected return 8% std=0.2
Stock C: Expected return 4% std=.3
The covariance variance matrix is given by:
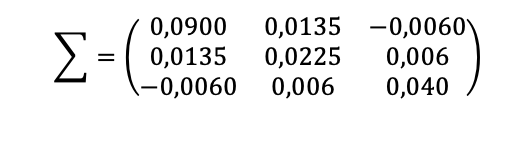
the portfolio weights in the minimum variance portfolio is given by:
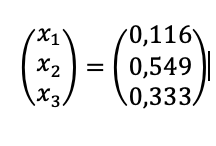
and its std is given by 0,12
-( 0,0900 0,0135 -0,0060 0,0135 -0,0060 0,0225 0,006 0,006 0,040 "1 2 , 10,116) 0,549 10,333 ) -( 0,0900 0,0135 -0,0060 0,0135 -0,0060 0,0225 0,006 0,006 0,040 "1 2 , 10,116) 0,549 10,333 )
Step by Step Solution
There are 3 Steps involved in it
1 Expert Approved Answer
Step: 1 Unlock

Question Has Been Solved by an Expert!
Get step-by-step solutions from verified subject matter experts
Step: 2 Unlock
Step: 3 Unlock