

Question: Plot the time series data and determine whether there appear to be a significant trend in the sales data? (4 marks) If we want to
- Plot the time series data and determine whether there appear to be a significant trend in the sales data? (4 marks)
- If we want to use simple linear regression to forecast the sales of the fourth quarter of 2021, what is the forecast? Is it a good forecasting method for the data set? Explain why. (4 marks)
- If you want to improve the forecasting of linear regression in part B, how would you do? What is the new forecasting of the sales of the fourth quarter of 2021 (4 marks)
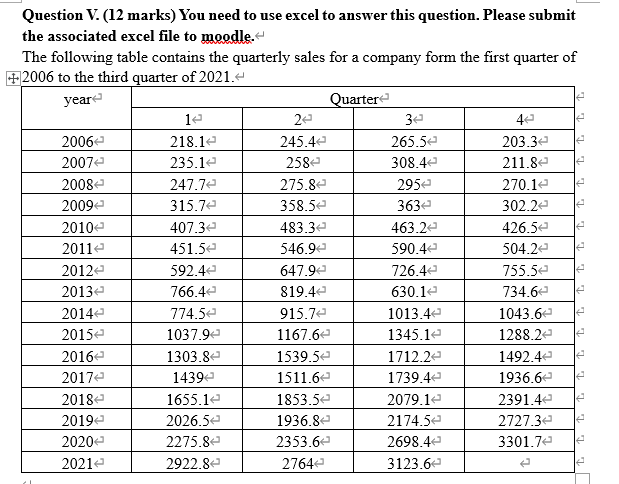
Question V. (12 marks) You need to use excel to answer this question. Please submit the associated excel file to moodle. The following table contains the quarterly sales for a company form the first quarter of +2006 to the third quarter of 2021.
Step by Step Solution
There are 3 Steps involved in it
1 Expert Approved Answer
Step: 1 Unlock

Question Has Been Solved by an Expert!
Get step-by-step solutions from verified subject matter experts
Step: 2 Unlock
Step: 3 Unlock