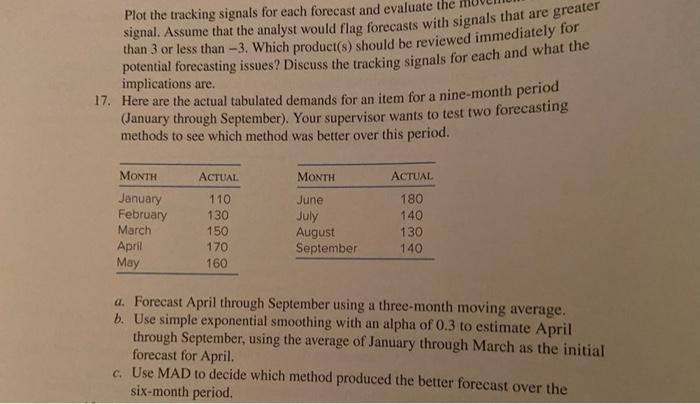
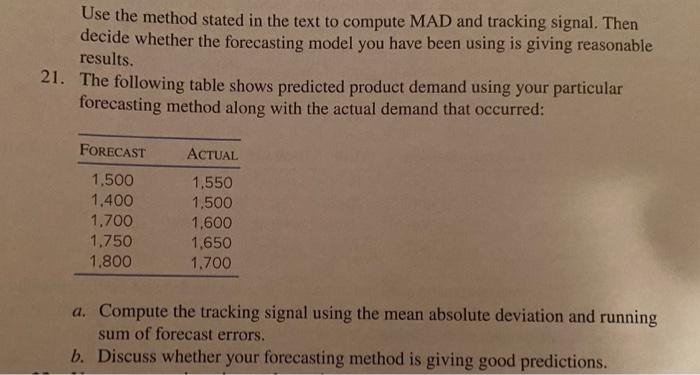
Question: Plot the tracking signals for each forecast and evaluate the movels that are greater signal. Assume that the analyst would flag forecasts with signals that

Plot the tracking signals for each forecast and
Plot the tracking signals for each forecast and evaluate the movels that are greater signal. Assume that the analyst would flag forecasts with signals that are greater than 3 or less than 3. Which product(s) should be reviewed immediately for potential forecasti implications are. implications are. (January through September). Your supervisor wants to test two forecasting methods to see which method was better over this period. a. Forecast April through September using a three-month moving average. b. Use simple exponential smoothing with an alpha of 0.3 to estimate April through September, using the average of January through March as the initial forecast for April. c. Use MAD to decide which method produced the better forecast over the six-month period. Use the method stated in the text to compute MAD and tracking signal. Then decide whether the forecasting model you have been using is giving reasonable results. The following table shows predicted product demand using your particular forecasting method along with the actual demand that occurred: a. Compute the tracking signal using the mean absolute deviation and running sum of forecast errors. b. Discuss whether your forecasting method is giving good predictions

Step by Step Solution

There are 3 Steps involved in it

1 Expert Approved Answer
Step: 1 Unlock blur-text-image
Question Has Been Solved by an Expert!

Get step-by-step solutions from verified subject matter experts

Step: 2 Unlock
Step: 3 Unlock

Students Have Also Explored These Related General Management Questions!