

Question: Just B and C , please put in Excel Plot the tracking signals for each forecast and evaluate the movement of the signal. Assume that
Just B and C , please put in Excel 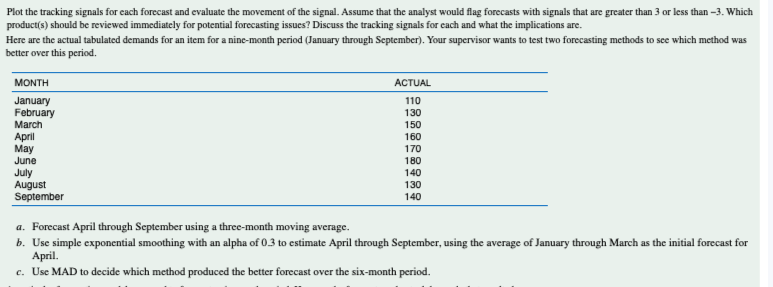
Plot the tracking signals for each forecast and evaluate the movement of the signal. Assume that the analyst would flag forecasts with signals that are greater than 3 or less than -3 . Which product(s) should be reviewed immediately for potential forecasting issues? Discuss the tracking signals for each and what the implications are. Here are the actual tabulated demands for an item for a nine-month period (January through September). Your supervisor wants to test two forecasting methods to see which method was better over this period. a. Forecast April through September using a three-month moving average. b. Use simple exponential smoothing with an alpha of 0.3 to estimate April through September, using the average of January through March as the initial forecast for April. c. Use MAD to decide which method produced the better forecast over the six-month period
Step by Step Solution
There are 3 Steps involved in it

Get step-by-step solutions from verified subject matter experts