

Question: - Plot the yield curve for each year between 2006-2022 and display these data on one graph. - For each year indicate the shape of
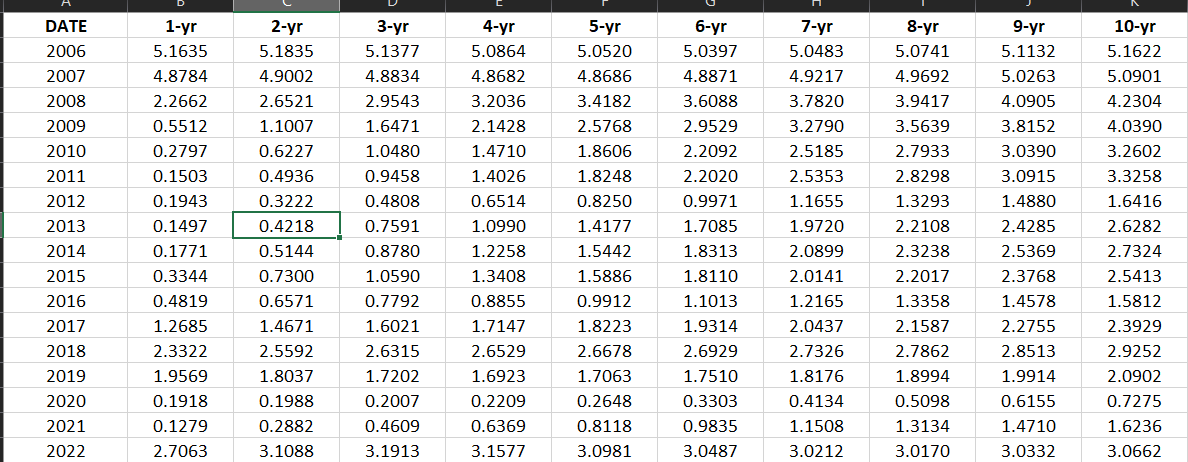
- Plot the yield curve for each year between 2006-2022 and display these data on one graph. - For each year indicate the shape of the yield curve, i.e., Normal, Inverted, or Flat. - Calculate and plot the series of one-year forward rates for each year between 2006 2022 , i.e., 2f1,3f1,4f1,5f1,6f1,7f1,8f1,9f1,10f1 the presentation must include your forward rate estimates. - For each forward-rate curve indicate the expected direction of future short-term rates, i.e., Increasing, Decreasing, Constant. To complete this assignment, one of your colleagues has provided you with the attached spreadsheet that contains mid-year, constant-maturity and zero-coupon yields from 2006 2022. These data are published by the Board of Governors of the Federal Reserve System and represents "constant maturity" and zero-coupon yields that are interpolated by the U.S. Treasury from the daily yield curve for non-inflation-indexed Treasury securities. These yields - Plot the yield curve for each year between 2006-2022 and display these data on one graph. - For each year indicate the shape of the yield curve, i.e., Normal, Inverted, or Flat. - Calculate and plot the series of one-year forward rates for each year between 2006 2022 , i.e., 2f1,3f1,4f1,5f1,6f1,7f1,8f1,9f1,10f1 the presentation must include your forward rate estimates. - For each forward-rate curve indicate the expected direction of future short-term rates, i.e., Increasing, Decreasing, Constant. To complete this assignment, one of your colleagues has provided you with the attached spreadsheet that contains mid-year, constant-maturity and zero-coupon yields from 2006 2022. These data are published by the Board of Governors of the Federal Reserve System and represents "constant maturity" and zero-coupon yields that are interpolated by the U.S. Treasury from the daily yield curve for non-inflation-indexed Treasury securities. These yields
Step by Step Solution
There are 3 Steps involved in it

Get step-by-step solutions from verified subject matter experts