

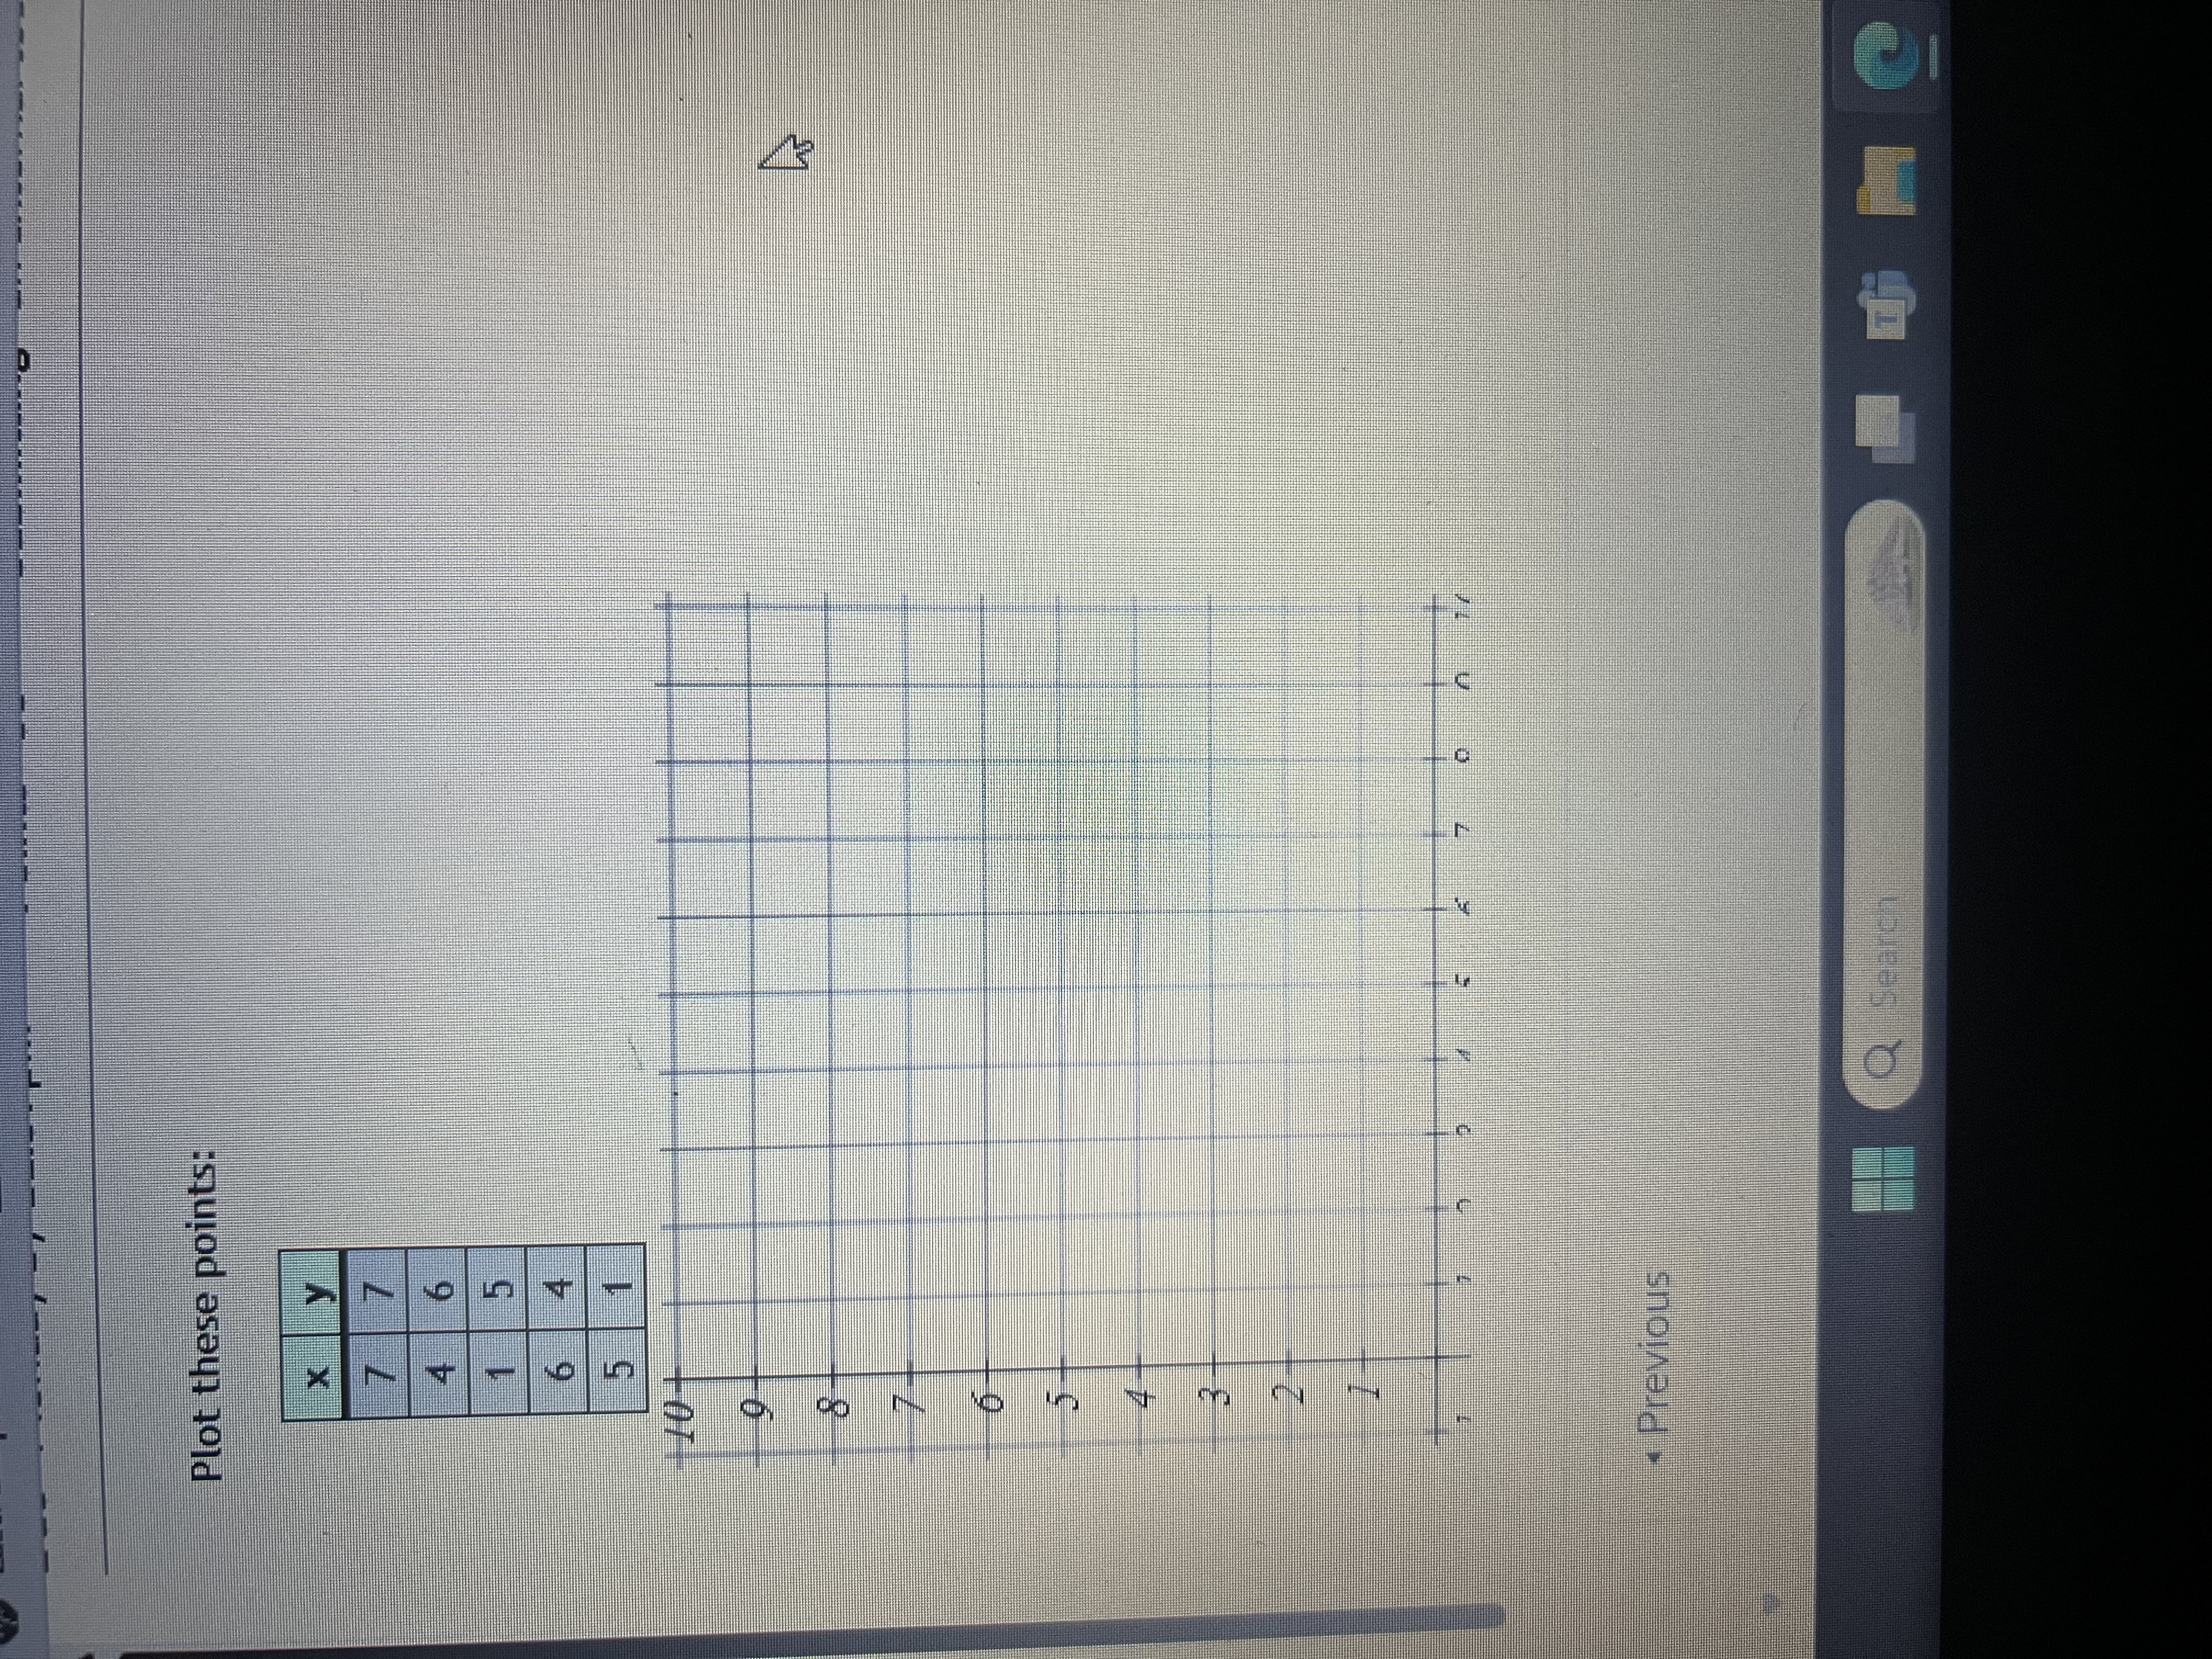
Question: Plot these points: X Y 7 7 4 6 1 5 6 4 5 10+ 9 8 7 6 5 4 2 1 Previous
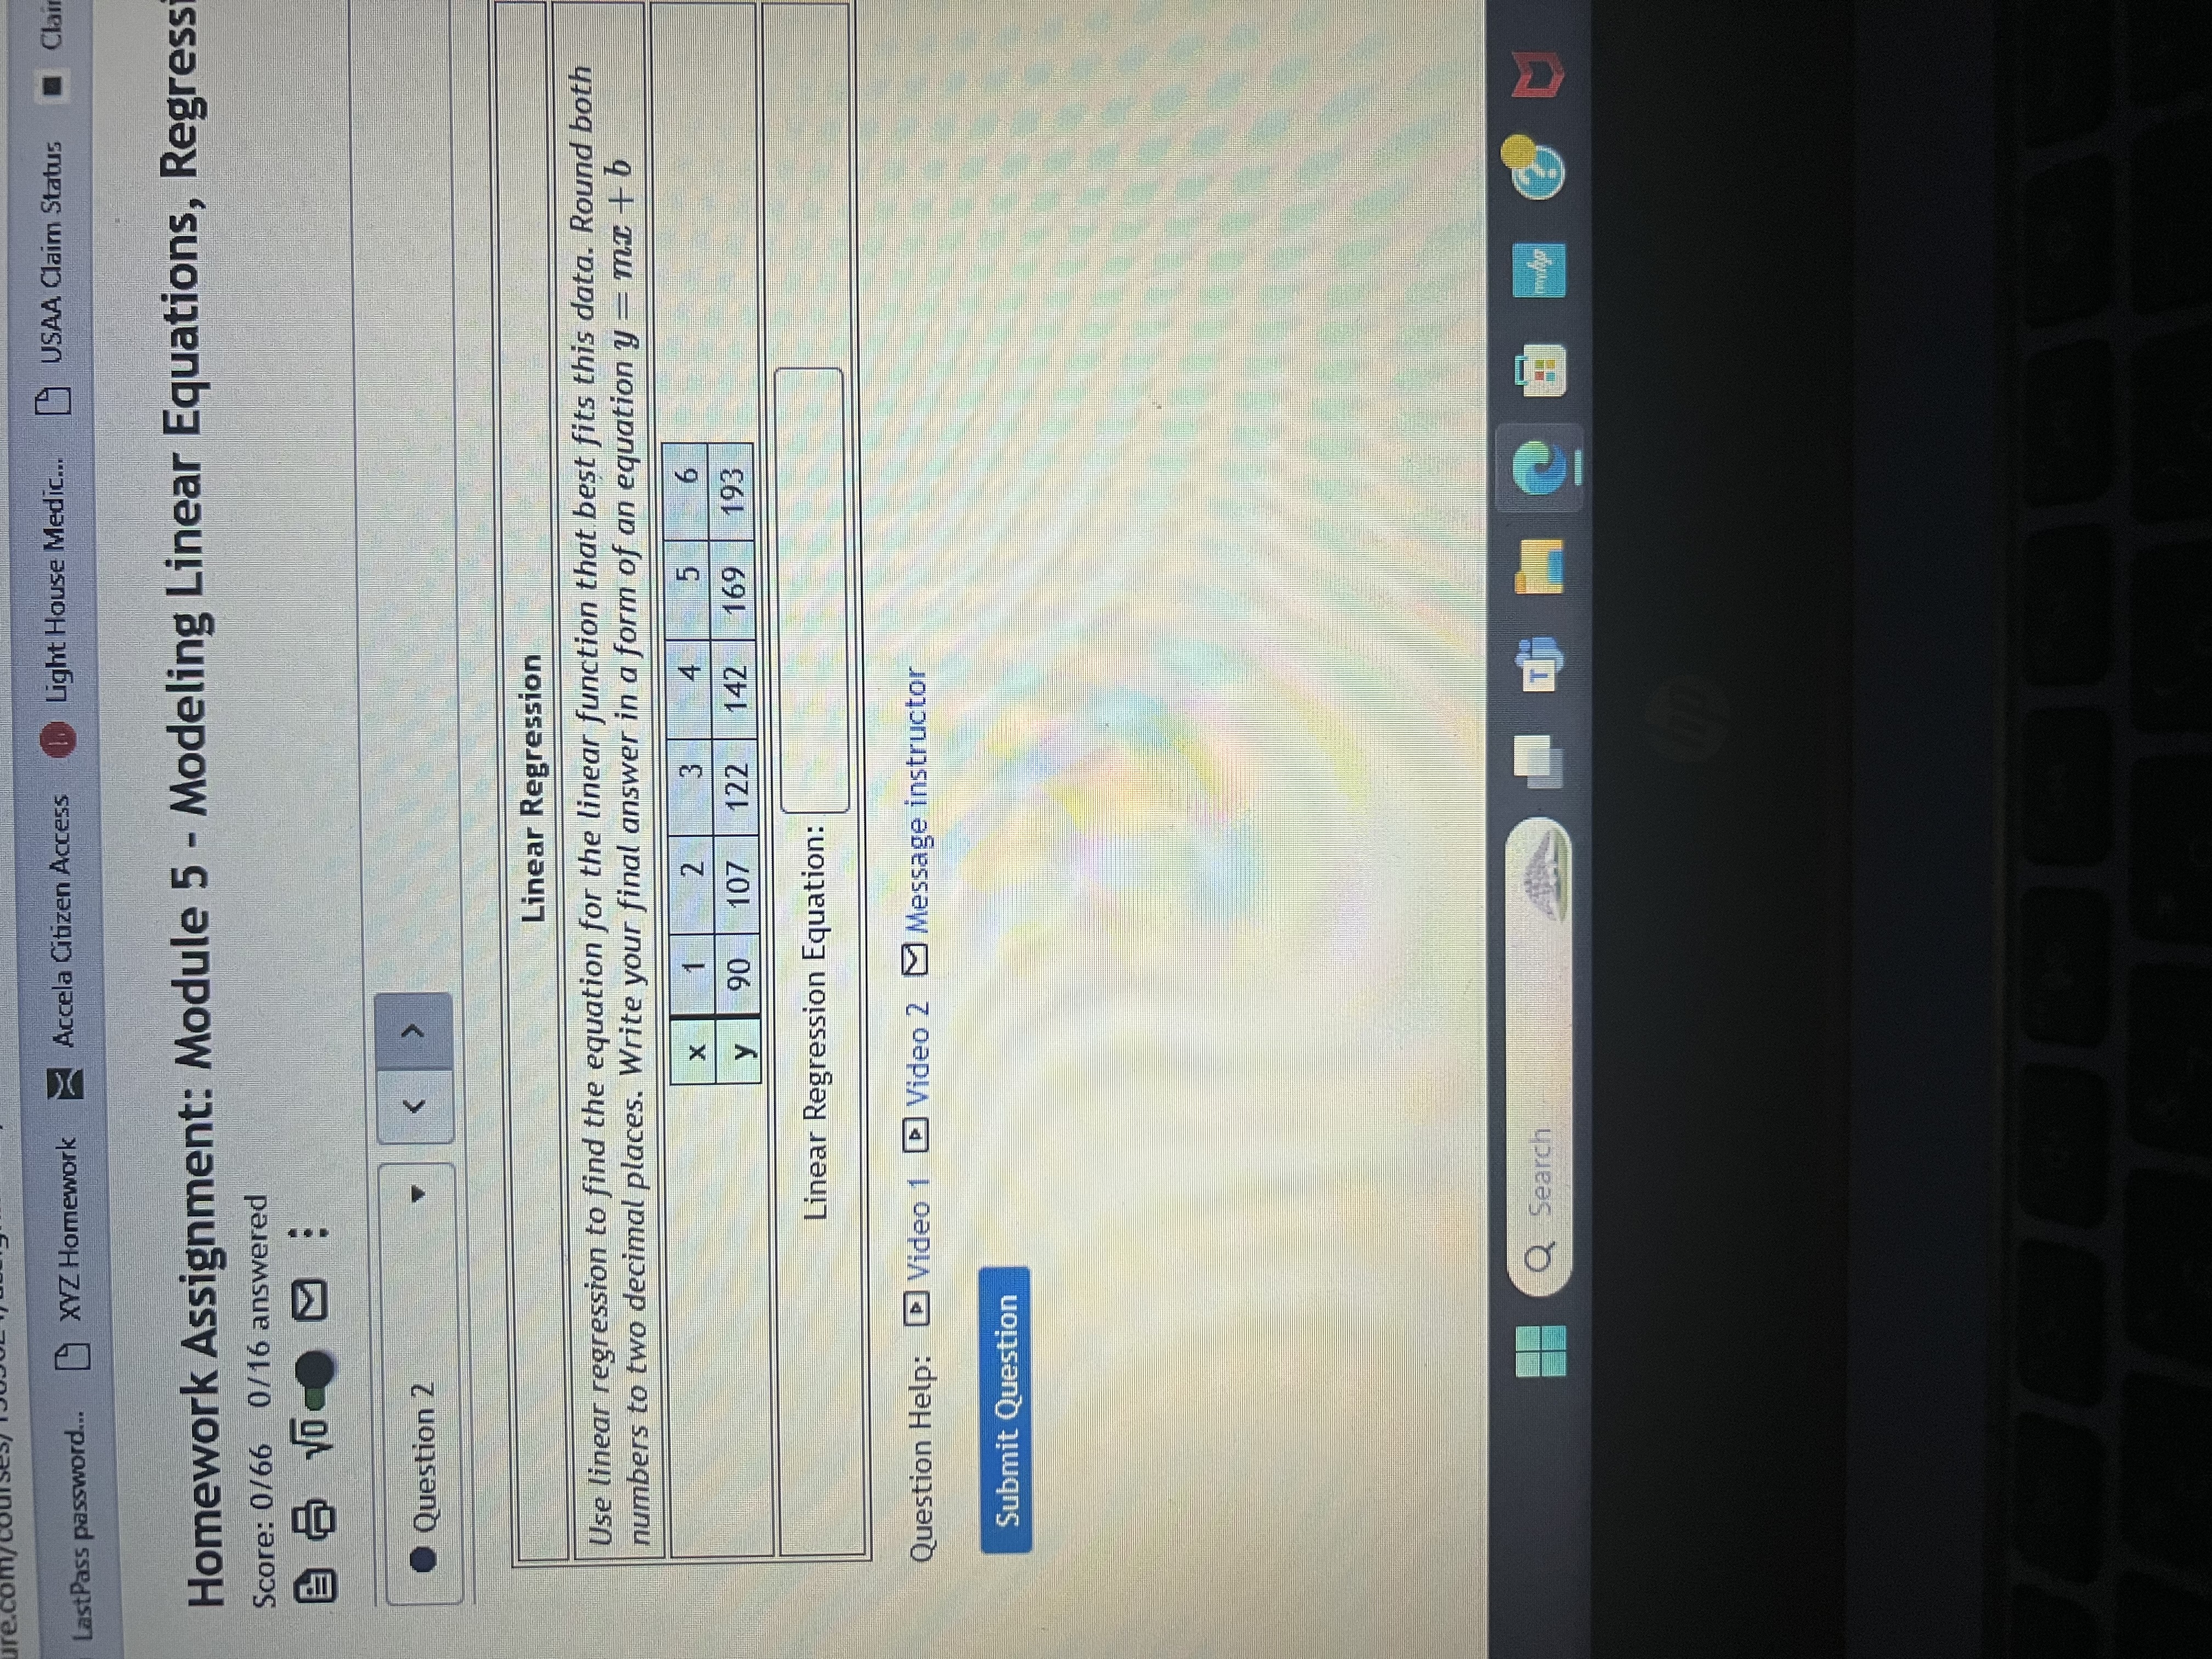
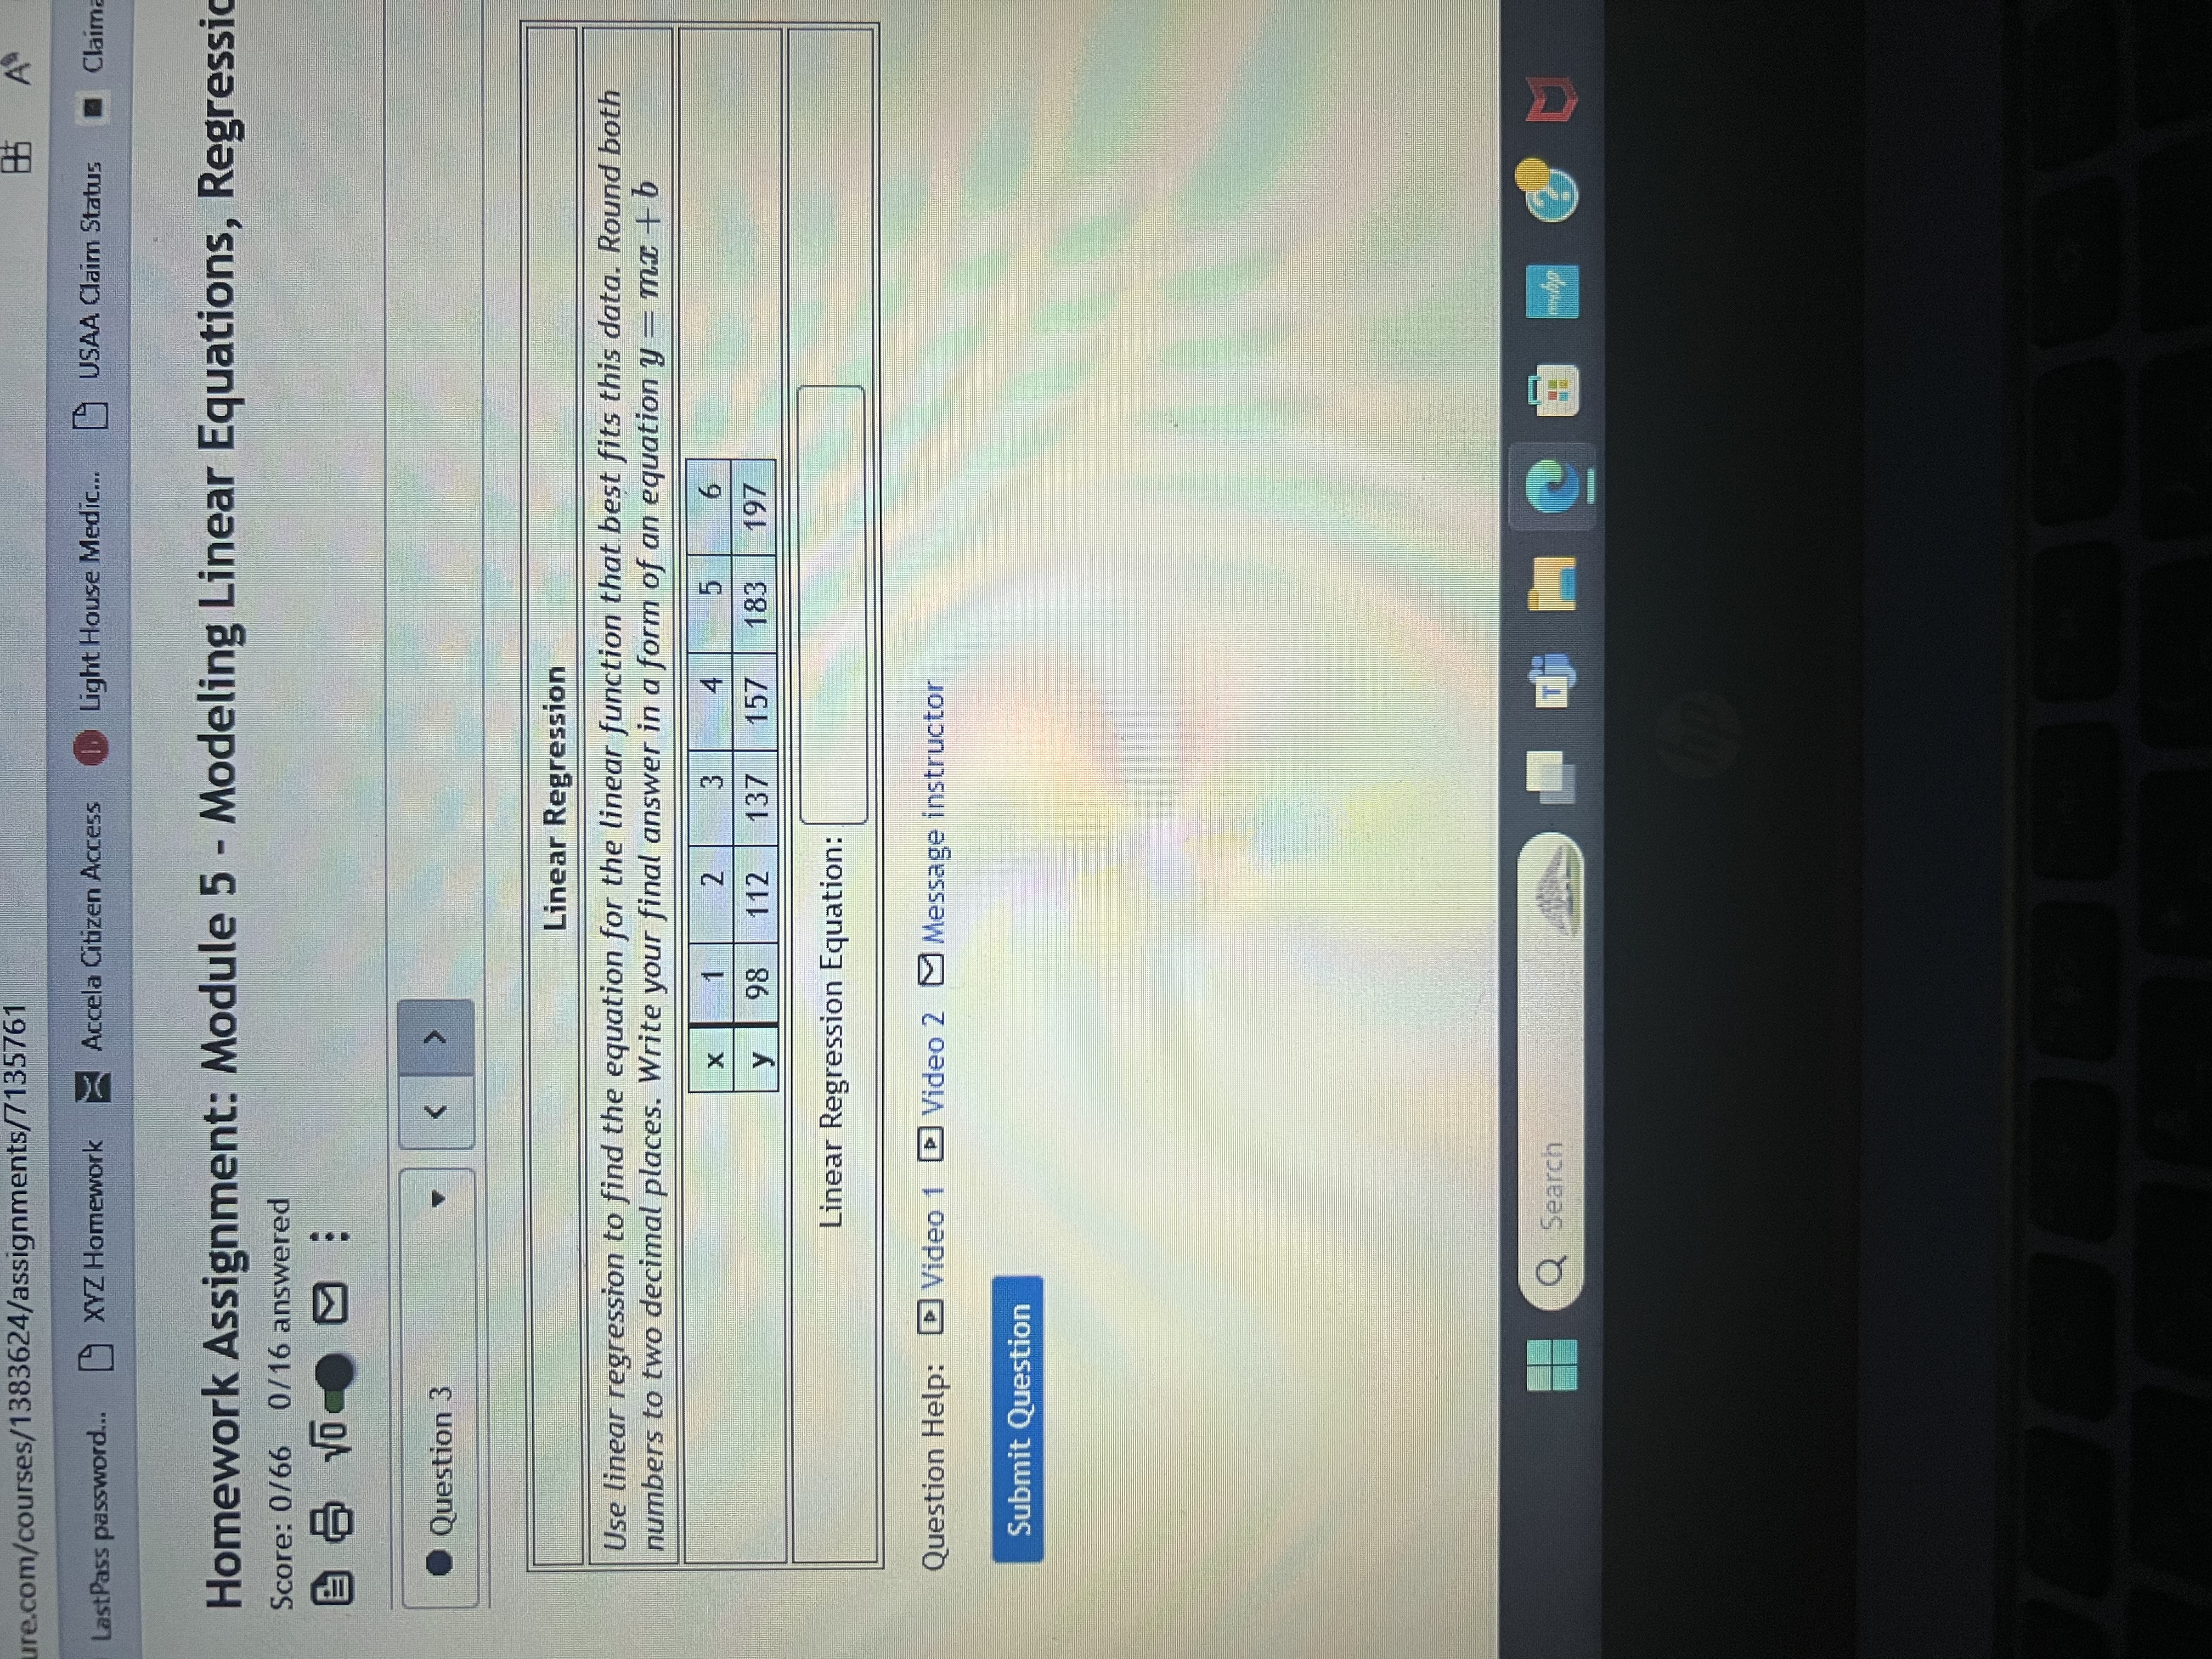
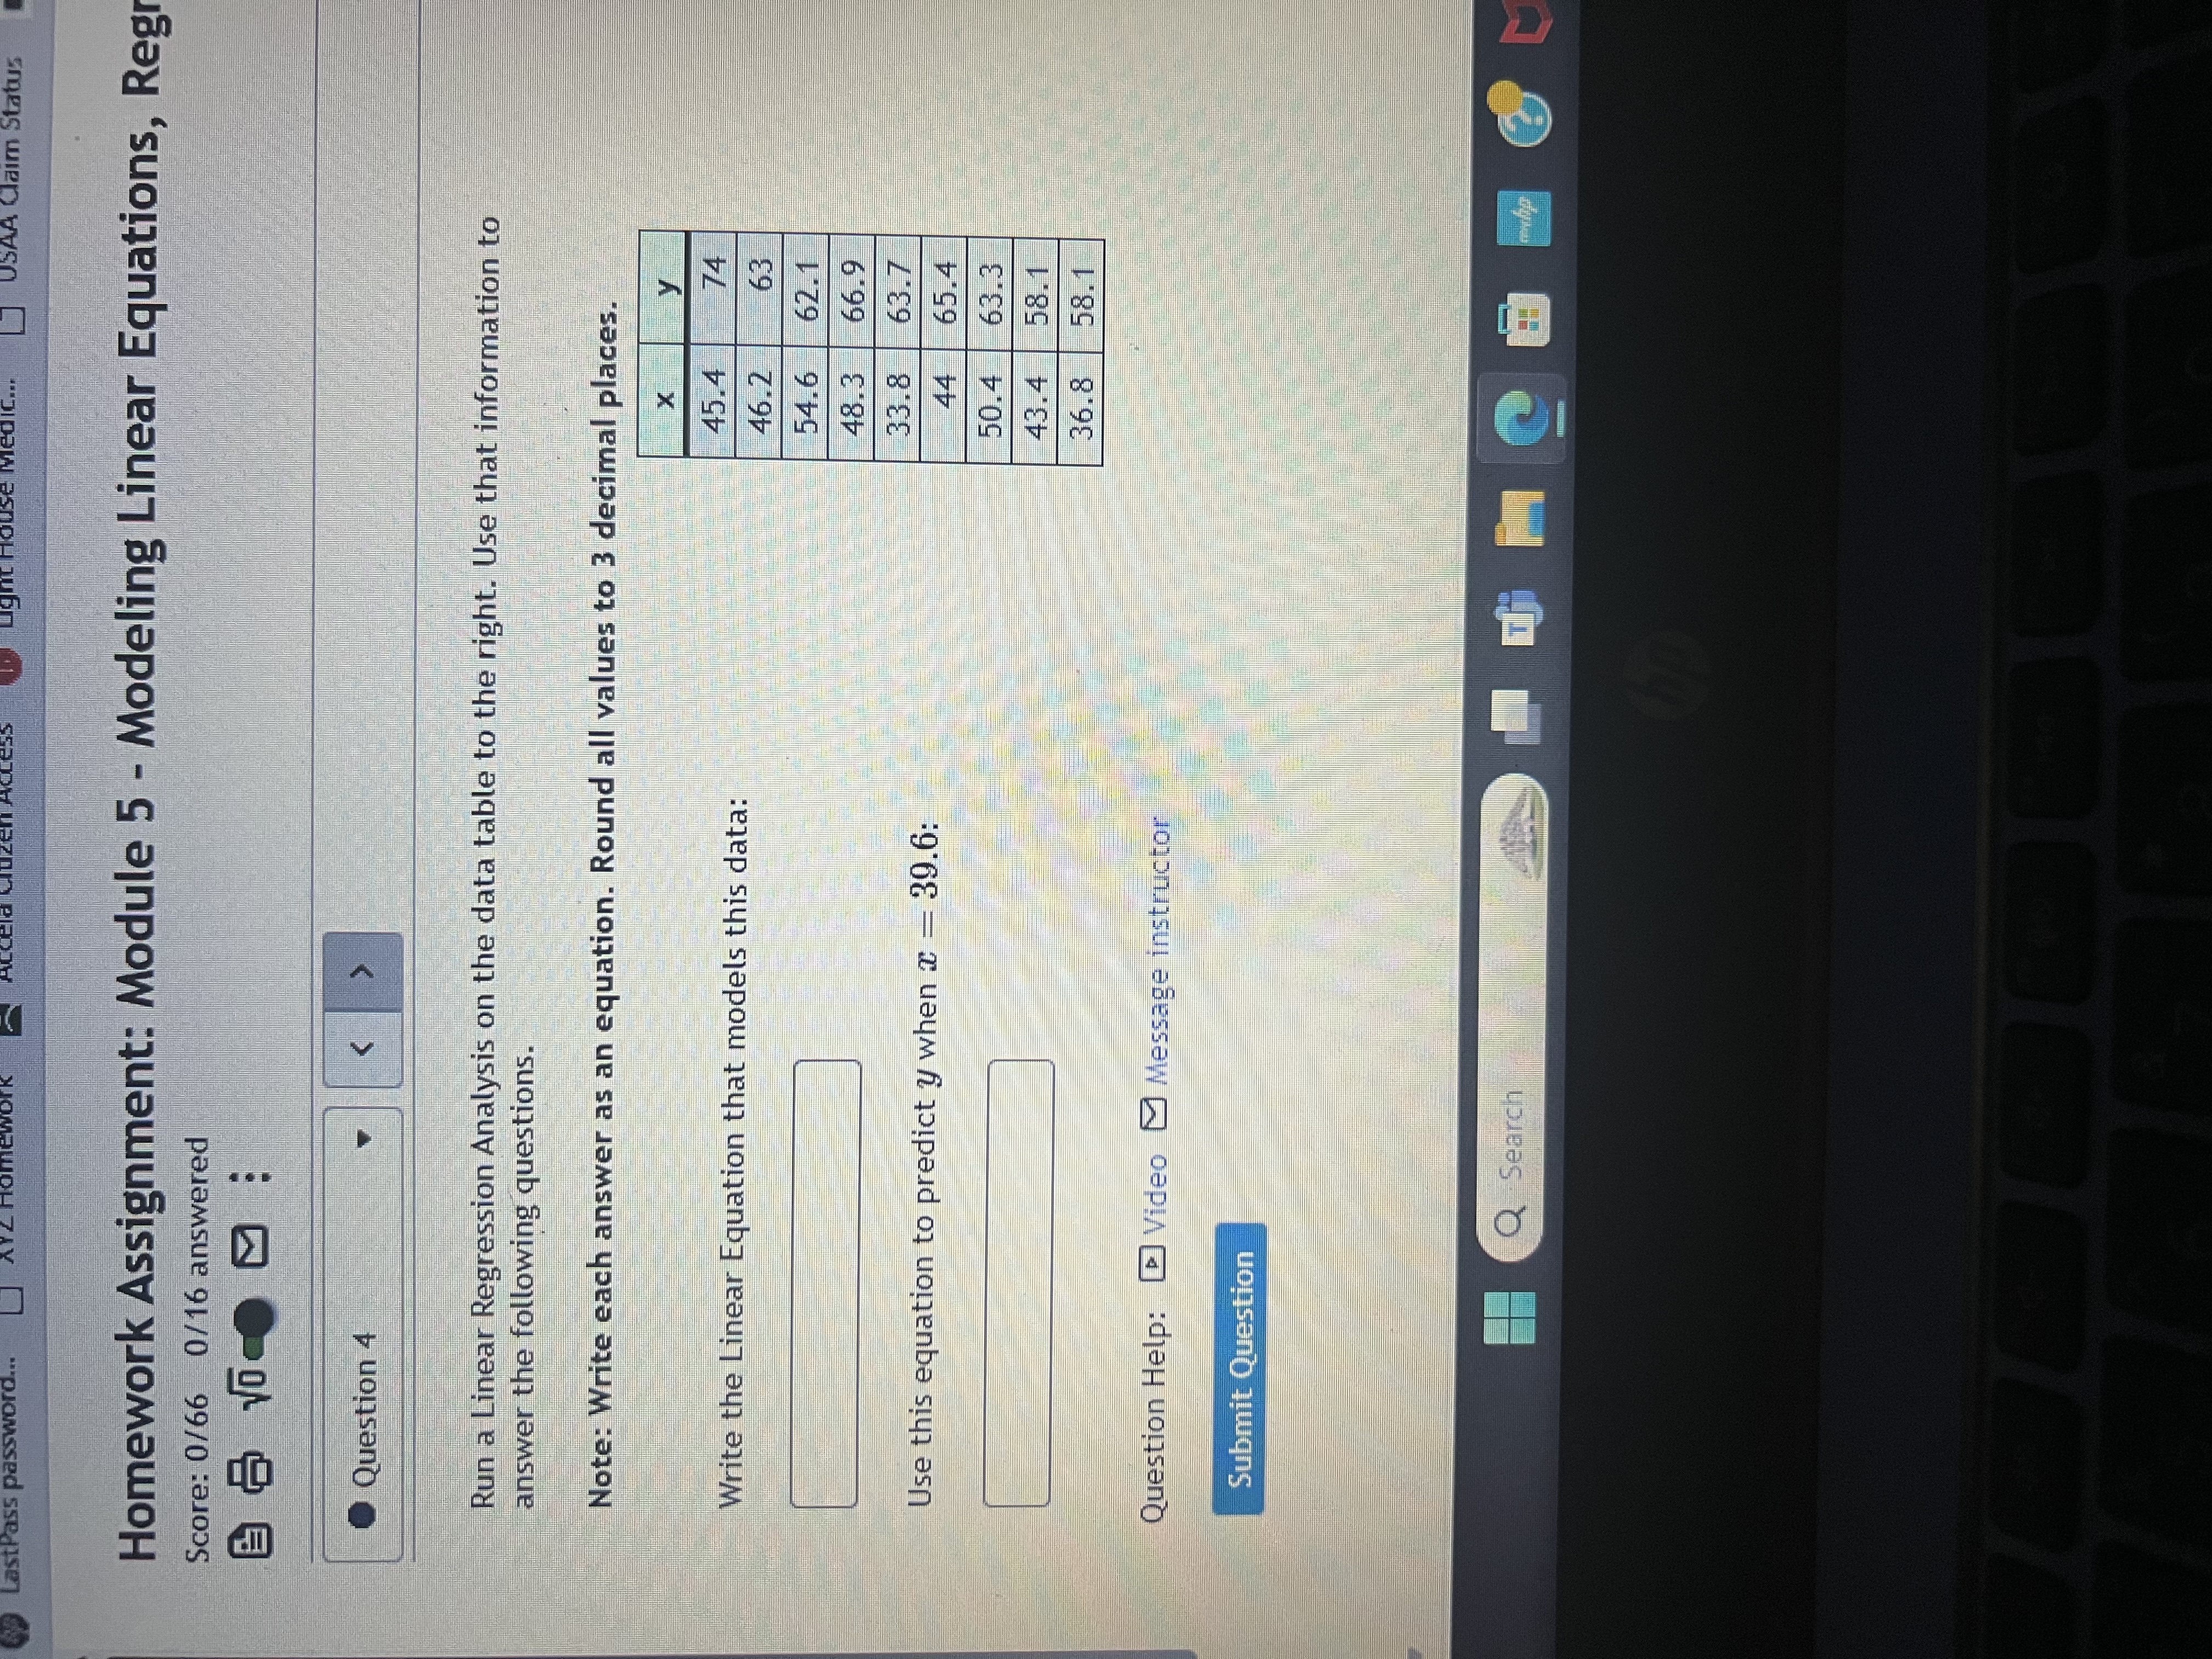
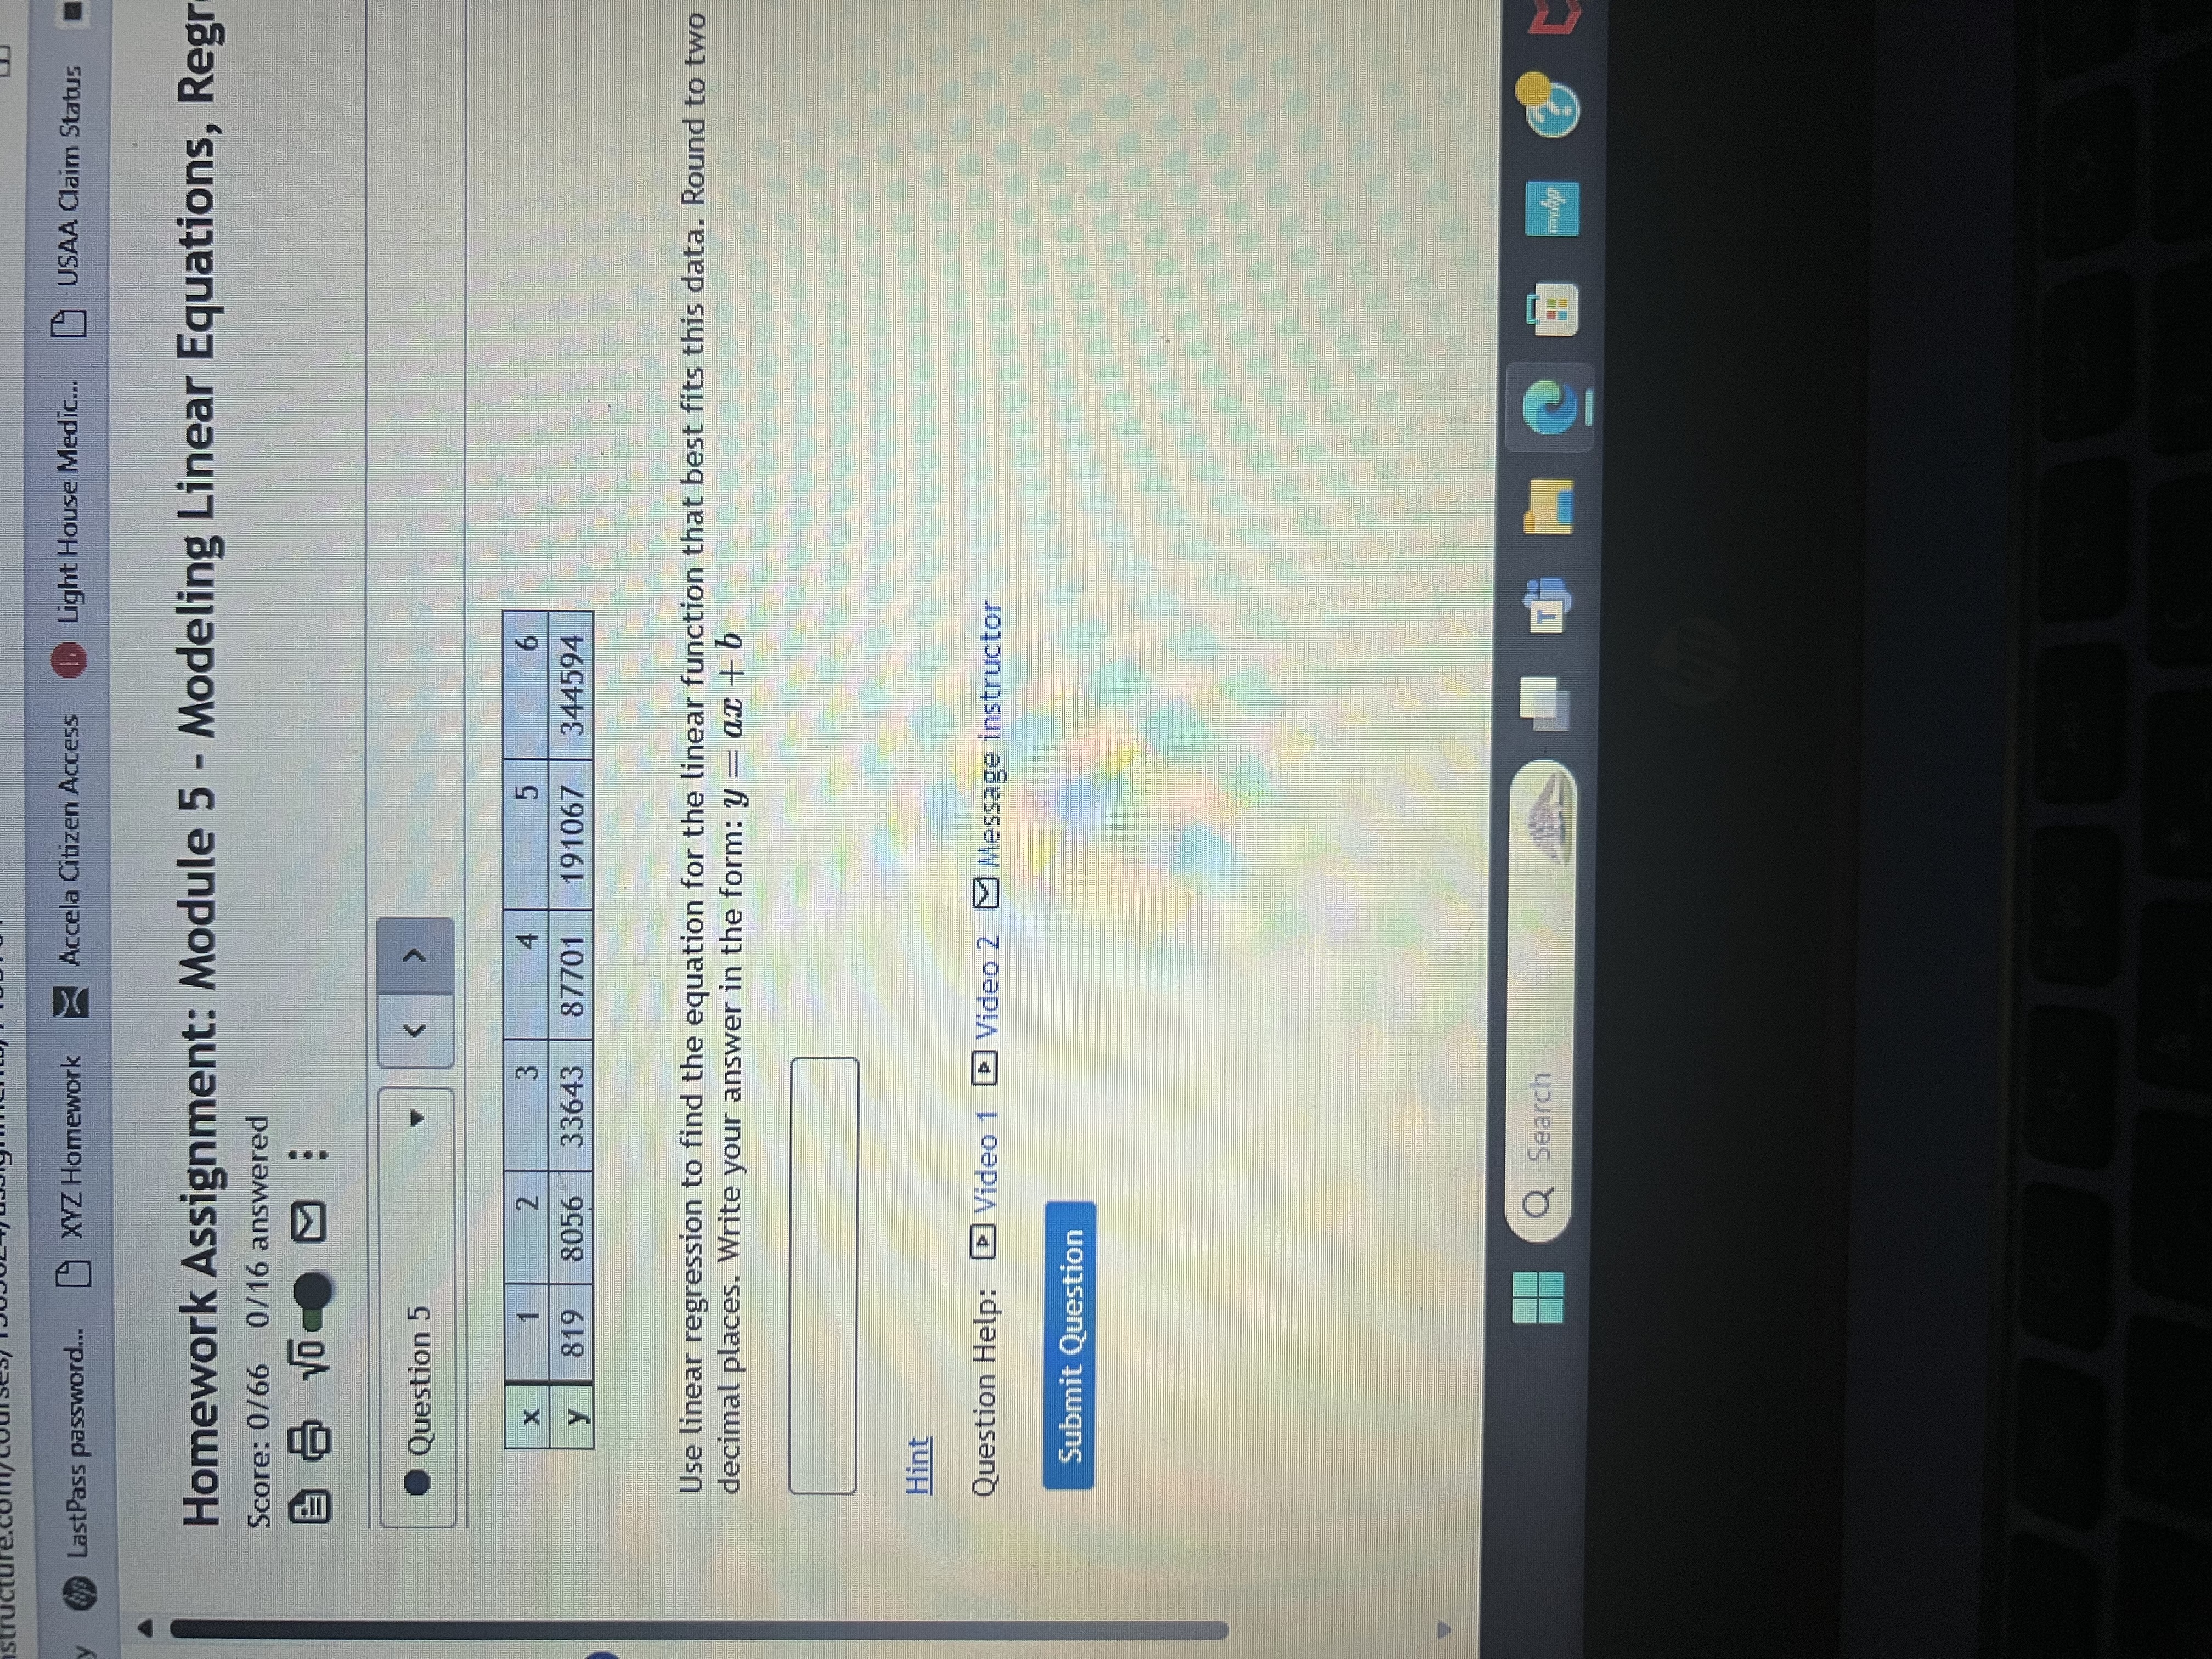
Plot these points: X Y 7 7 4 6 1 5 6 4 5 10+ 9 8 7 6 5 4 2 1 Previous Q Search ure.com/co LastPass password... XYZ Homework Accela Citizen Access Light House Medic... USAA Claim Status Clair Homework Assignment: Module 5 - Modeling Linear Equations, Regressi Score: 0/66 0/16 answered @ 8 Question 2 : > Linear Regression Use linear regression to find the equation for the linear function that best fits this data. Round both numbers to two decimal places. Write your final answer in a form of an equation y mx+b X 1 2 3 4 5 6 y 90 107 122 142 169 193 Linear Regression Equation: Question Help: Video 1 Video 2 Message instructor Submit Question Q Search D ure.com/courses/1383624/assignments/7135761 BA LastPass password... XYZ Homework Accela Citizen Access Light House Medic... USAA Claim Status Claima Homework Assignment: Module 5 - Modeling Linear Equations, Regressic Score: 0/66 0/16 answered @ 8 Question 3 : Linear Regression Use linear regression to find the equation for the linear function that best fits this data. Round both numbers to two decimal places. Write your final answer in a form of an equation y = mx +b X 1 2 3 4 5 6 y 98 112 137 157 183 197 Linear Regression Equation: Question Help: Video 1 Video 2 Message instructor Submit Question Q Search LastPass password... XYZ Homework Accela Muzen Access Ught House Medic... USAA Claim Status Homework Assignment: Module 5 - Modeling Linear Equations, Regr Score: 0/66 0/16 answered @ 8 Question 4 : < Run a Linear Regression Analysis on the data table to the right. Use that information to answer the following questions. Note: Write each answer as an equation. Round all values to 3 decimal places. y 45.4 74 Write the Linear Equation that models this data: 46.2 63 54.6 62.1 48.3 66.9 33.8 63.7 Use this equation to predict y when x 39.6: Question Help: Video Message instructor 44 65.4 50.4 63.3 43.4 58.1 36.8 58.1 Submit Question Q Search mehp structure.com/S/TJQJ02gto y LastPass password... XYZ Homework Accela Citizen Access Light House Medic... USAA Claim Status Homework Assignment: Module 5 - Modeling Linear Equations, Regr Score: 0/66 0/16 answered @ 8 : Question 5 X 1 2 3 4 5 6 A 819 8056 33643 87701 191067 344594 Use linear regression to find the equation for the linear function that best fits this data. Round to two decimal places. Write your answer in the form: y = ax + b Hint Question Help: Video 1 Video 2 Message instructor Submit Question Q Search
Step by Step Solution
There are 3 Steps involved in it

Get step-by-step solutions from verified subject matter experts