

Question: Plot this graph in SAS 8. Use an iterative DO loop to plot the following equation: Logit - logp / (1 - p) Use values
Plot this graph in SAS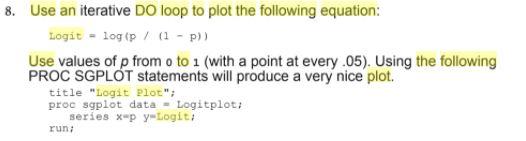
8. Use an iterative DO loop to plot the following equation: Logit - logp / (1 - p) Use values of p from o to 1 (with a point at every .05). Using the following PROC SGPLOT statements will produce a very nice plot. title "Logit plot": proc sgplot data - Logitplot; series xup y Logiti runi
Step by Step Solution
There are 3 Steps involved in it
1 Expert Approved Answer
Step: 1 Unlock

Question Has Been Solved by an Expert!
Get step-by-step solutions from verified subject matter experts
Step: 2 Unlock
Step: 3 Unlock