

Question: Plot those points on the graph below. 1300 1200 1100 1000 900 800- 700 600 500 400 300- 200 100 10 20 30 40
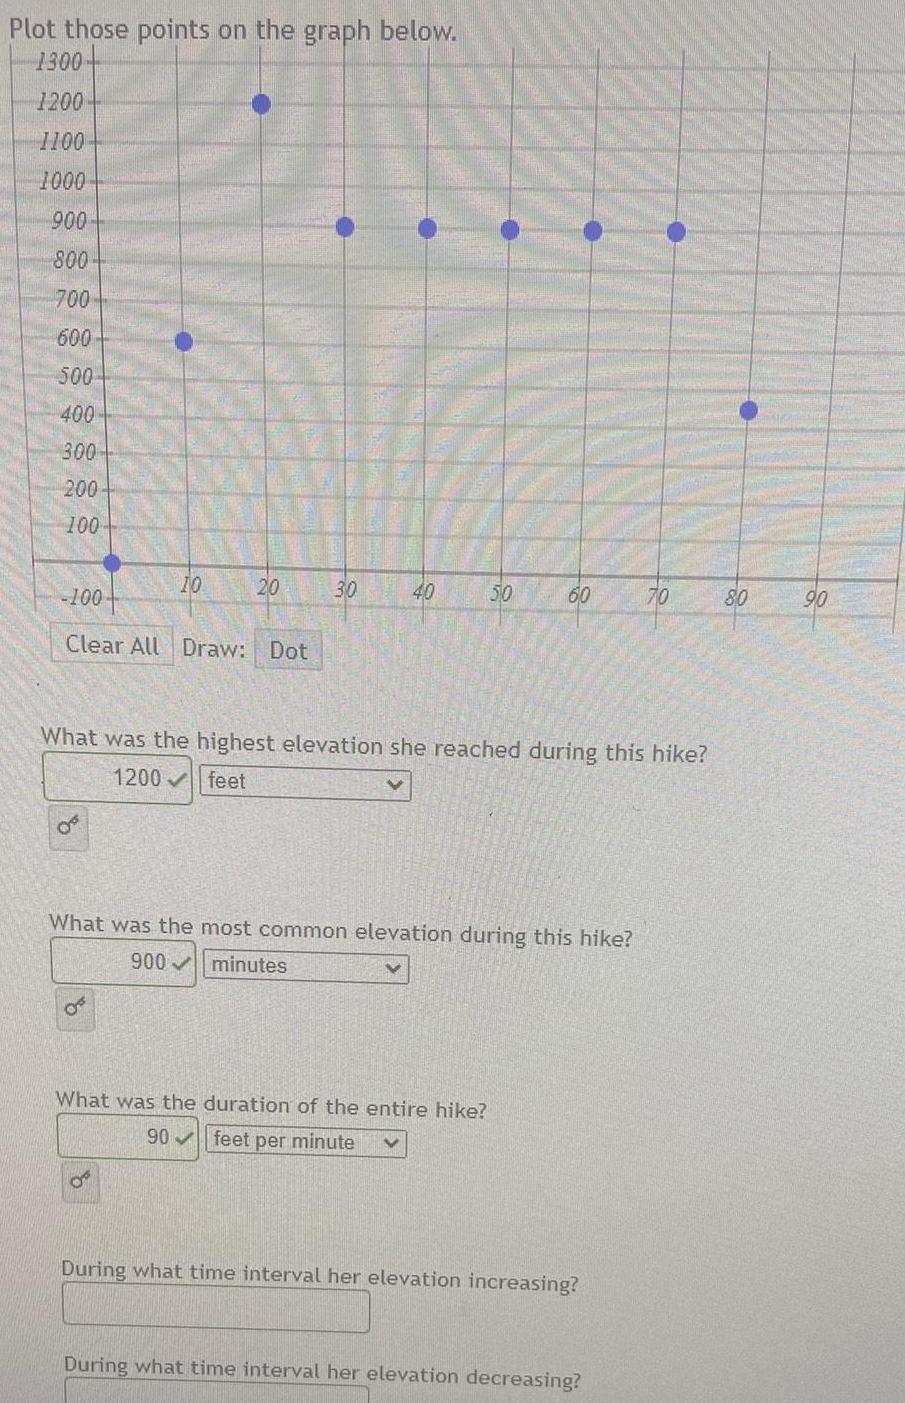
Plot those points on the graph below. 1300 1200 1100 1000 900 800- 700 600 500 400 300- 200 100 10 20 30 40 50 60 70 80 90 -100- Clear All Draw: Dot What was the highest elevation she reached during this hike? 1200 feet What was the most common elevation during this hike? 900 minutes OFF What was the duration of the entire hike? 90 feet per minute During what time interval her elevation increasing? During what time interval her elevation decreasing?
Step by Step Solution
There are 3 Steps involved in it
1 Expert Approved Answer
Step: 1 Unlock

Question Has Been Solved by an Expert!
Get step-by-step solutions from verified subject matter experts
Step: 2 Unlock
Step: 3 Unlock