

Question: Plotting algebraic functions Write a script that plots f ( x ) = 5 e - 2 x for 1 0 3 evenly - space
Plotting algebraic functions
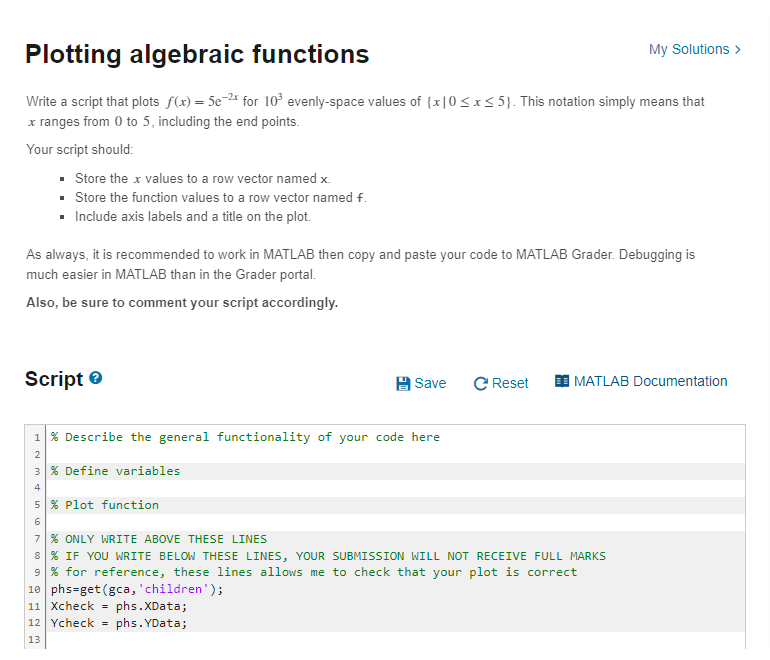
Write a script that plots for evenlyspace values of This notation simply means that
ranges from to including the end points.
Your script should:
Store the values to a row vector named
Store the function values to a row vector named
Include axis labels and a title on the plot.
As always, it is recommended to work in MATLAB then copy and paste your code to MATLAB Grader. Debugging is
much easier in MATLAB than in the Grader portal.
Also, be sure to comment your script accordingly.
Script
Describe the general functionality of your code here
Define variables
Plot function
ONLY WRITE ABOVE THESE LINES
IF YOU WRITE BELOW THESE LINES, YOUR SUBMISSION WILL NOT RECEIVE FULL MARKS
for reference, these lines allows me to check that your plot is correct
phsget gca 'children';
Xcheck phsXData;
Ycheck phs YData; Complete this code in MATLAB languge
Step by Step Solution
There are 3 Steps involved in it
1 Expert Approved Answer
Step: 1 Unlock

Question Has Been Solved by an Expert!
Get step-by-step solutions from verified subject matter experts
Step: 2 Unlock
Step: 3 Unlock