

Question: Pls ans quickly The table below shows demand and supply schedules in the market for eggs, which is presumed to be a constant-cost industry. m
Pls ans quickly
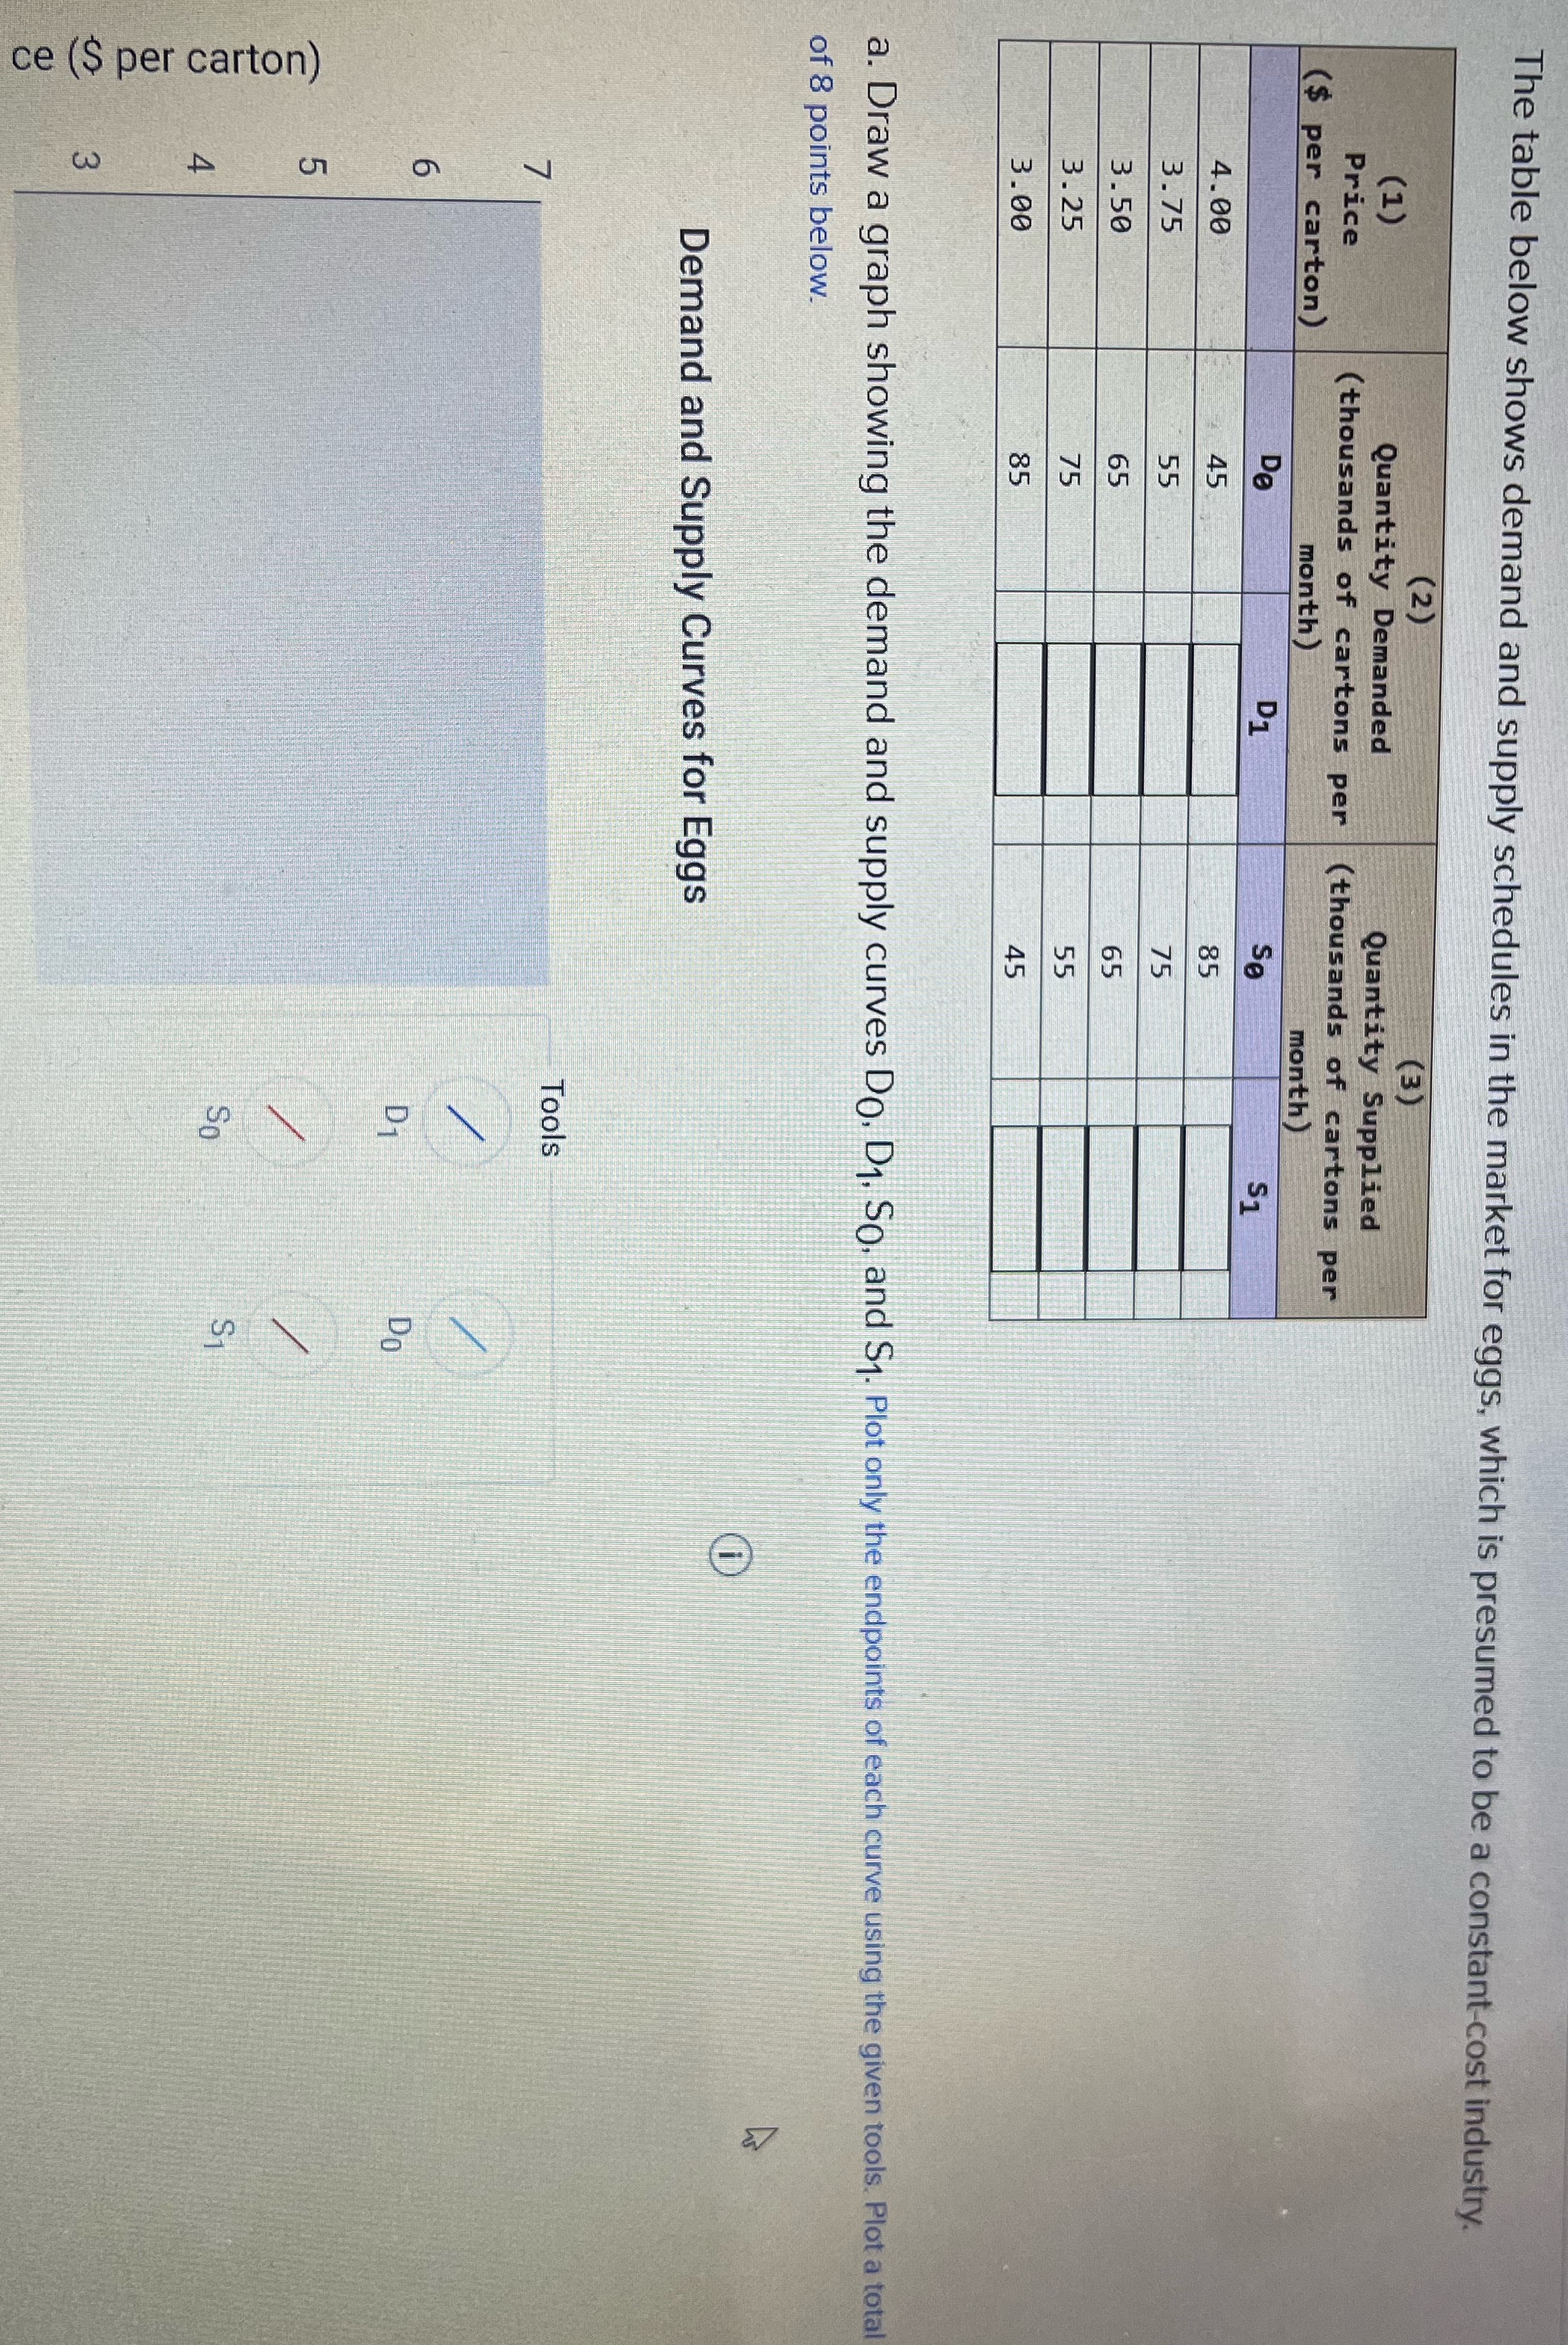
The table below shows demand and supply schedules in the market for eggs, which is presumed to be a constant-cost industry. m (1) Quantity Demanded Quantity Supplied Price thousands of cartons per ( thousands of cartons per ($ per carton) month) month) 4.00 3.75 3.50 3. 25 3.00 a. Draw a graph showing the demand and supply curves Do, D1. So, and $1. Plot only the endpoints of each curve using the given tools. Plot a total of 8 points below. Demand and Supply Curves for Eggs Tools LO ce ($ per carton)
Step by Step Solution
There are 3 Steps involved in it
1 Expert Approved Answer
Step: 1 Unlock

Question Has Been Solved by an Expert!
Get step-by-step solutions from verified subject matter experts
Step: 2 Unlock
Step: 3 Unlock